4D construction dashboard
Overview
The 4D Construction Dashboard serves as a specialized Digital Twin, integrating Building Information Modeling (IFC Data) with Construction Scheduling and Management. By linking the physical model (ifc) directly to the project schedule, it provides stakeholders with a "time-machine" view of the project's progress.
This tool is essential for Project Managers, Planners, and Site Engineers to validate schedules, track delays, and visualize the sequence of work before execution.
Input data requirements
To ensure the dashboard functions correctly, the input data MUST follow a strict structure. The Power BI model relies on a specific Excel template linked via parameters.
1. Download the template
Start by downloading the standard Excel template. Do not rename the sheets inside this workbook.
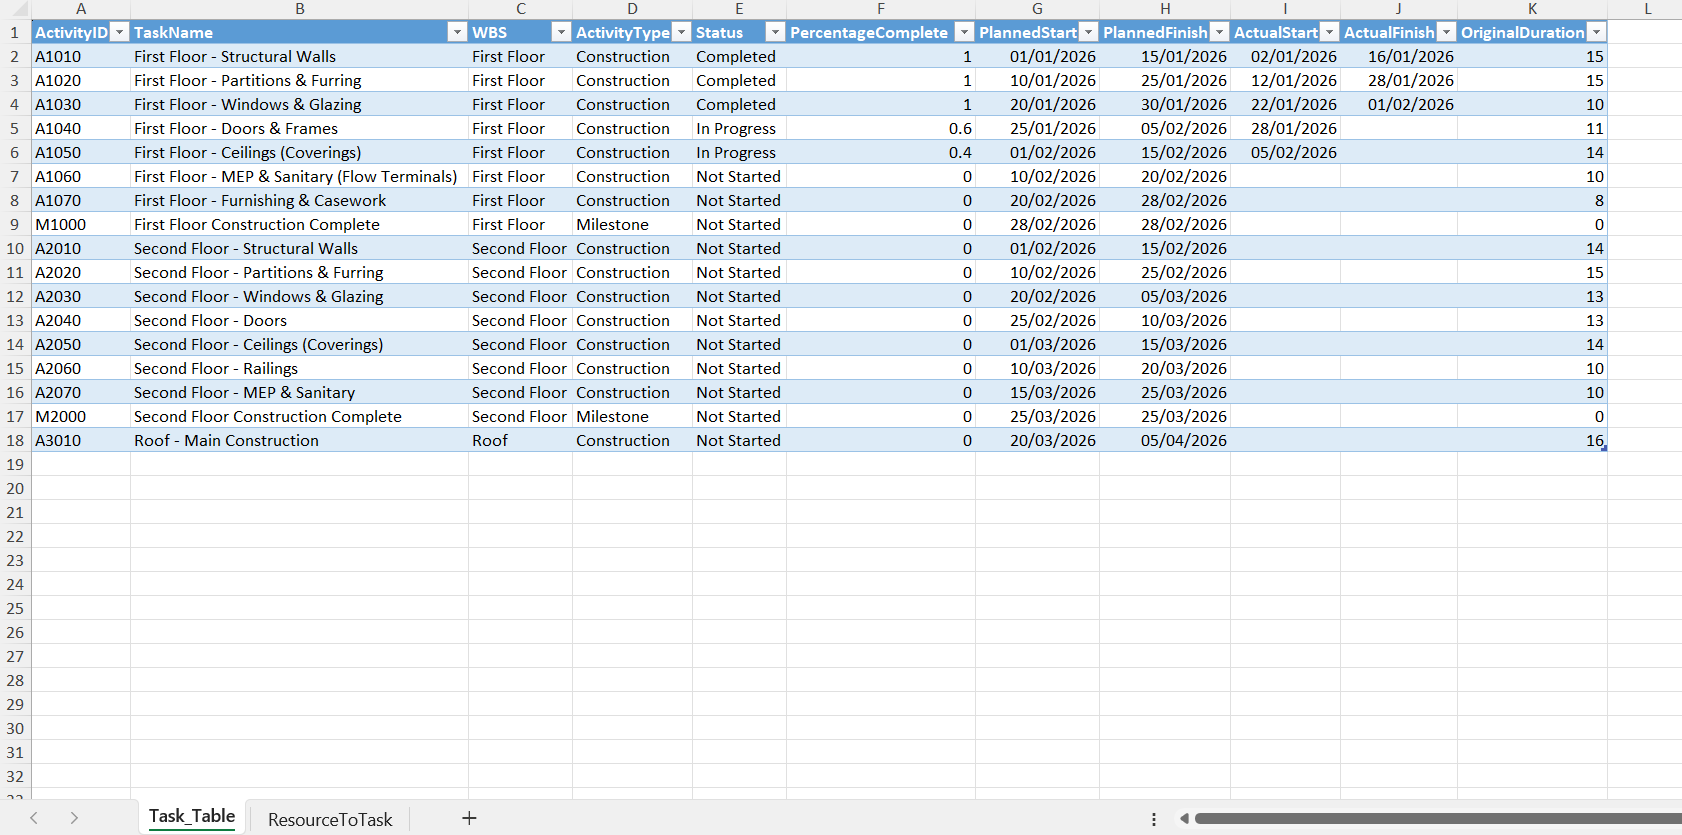
2. Sheet: Task_Table
This is the primary dataset driving the Gantt chart and 4D simulation.
Important
The sheet name must remain exactly Task_Table.
| Attribute name | Data type | Description and usage |
|---|---|---|
| ActivityID | Text / Number | Primary Key. A unique identifier for each task. This ID is often used to link with the BIM Model (e.g., matching the Mark or Tag parameter in Revit). |
| TaskName | Text | A descriptive name for the activity (e.g., "Pouring L2 Slab"). Appears in the Gantt Chart. |
| WBS | Text | Work Breakdown Structure. Used to group tasks hierarchically (e.g., "First Floor > Structure"). |
| Status | Text | Crucial for Coloring. Valid values are: Completed, In Progress, Not Started. This field directly controls the 3D visualization colors. |
| PercentageComplete | Decimal | Represents progress (0.0 to 1.0). Used for earned value calculations. |
| PlannedStart | Date | The scheduled start date. Must be a valid Date format. |
| PlannedFinish | Date | The scheduled finish date. Must be a valid Date format. |
| ActualStart | Date | (Optional) Real-world start date for comparison logic. |
| ActualFinish | Date | (Optional) Real-world finish date. |
| OriginalDuration | Number | The planned duration in days. |
The screenshot below shows a correctly populated Task_Table.
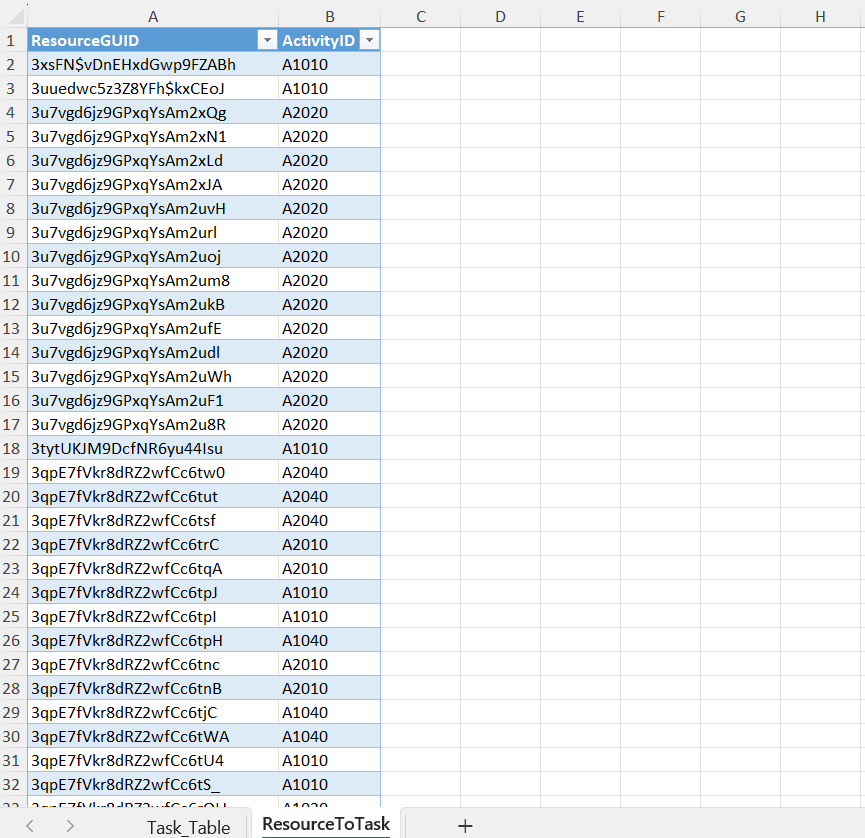
3. Sheet: ResourceToTask
This sheet handles the resource allocation logic by linking specific resources to project activities.
Important
The sheet name must remain exactly ResourceToTask.
| Attribute name | Data type | Description and usage |
|---|---|---|
| ResourceGUID | Text | Unique ID for the resource (Labor, Material, Equipment). |
| ActivityID | Text | Foreign Key. This MUST match an ActivityID from the Task_Table. It creates the relationship between the resource and the schedule task. |
The screenshot below shows resources linked to schedule activities in ResourceToTask.
Set up and configure the dashboard
Link your data
The dashboard is designed to be dynamic. You don't need to edit the Power BI file structure; simply update the connection parameter.
- Open the Power BI Report (.pbix).
- Go to Home > Transform Data > Edit Parameters.
- Locate the parameter named 4D_Planning_Template.
- Paste the full file path of your local Excel file.
* Example:
C:\Users\Name\Projects\4D_Schedule.xlsx - Click OK and then Apply Changes.
Update progress
As the project moves forward, you only need to update the Excel file:
- Open your linked Excel Workbook.
- Update the Status column (e.g., change specific tasks from "In Progress" to "Completed").
- Update PercentageComplete and Actual dates if necessary.
- Save the Excel file.
- In Power BI (or the Web Viewer), click the Refresh button. The Dashboard, Gantt Chart, and 3D Coloring will update instantly.
Technical logic: status and coloring
The dashboard utilizes a DAX Logic Matrix to assign statuses dynamically based on the comparison between the Timeline Date (selected by the user) and the Task Dates.
| Visual Status | Color Code | Logic Condition |
|---|---|---|
| Completed | Green | Work that has been fully finished historically (Task Finish Date < Selected Date). |
| In Progress | Yellow | Work currently active on site (Selected Date is between Start and Finish). |
| Not Started | Red / Transparent | Future scope. Often rendered with high transparency to focus on active work. |
| Delayed | Orange | Tasks where Planned Finish < Today but % Complete < 100%. |