Connect IFC data from Excel to Power BI
Overview
In this step-by-step guide, you will learn how to query IFC categories, sync their properties to Excel, and then bring that data into Power BI to create interactive visualizations.
Prerequisites
- IFC file with properties already generated.
- Access to an online Excel file location (e.g., OneDrive or SharePoint).
- Power BI account or Power BI Desktop installed.
- Organizational login credentials to Power BI.
Step-by-step process
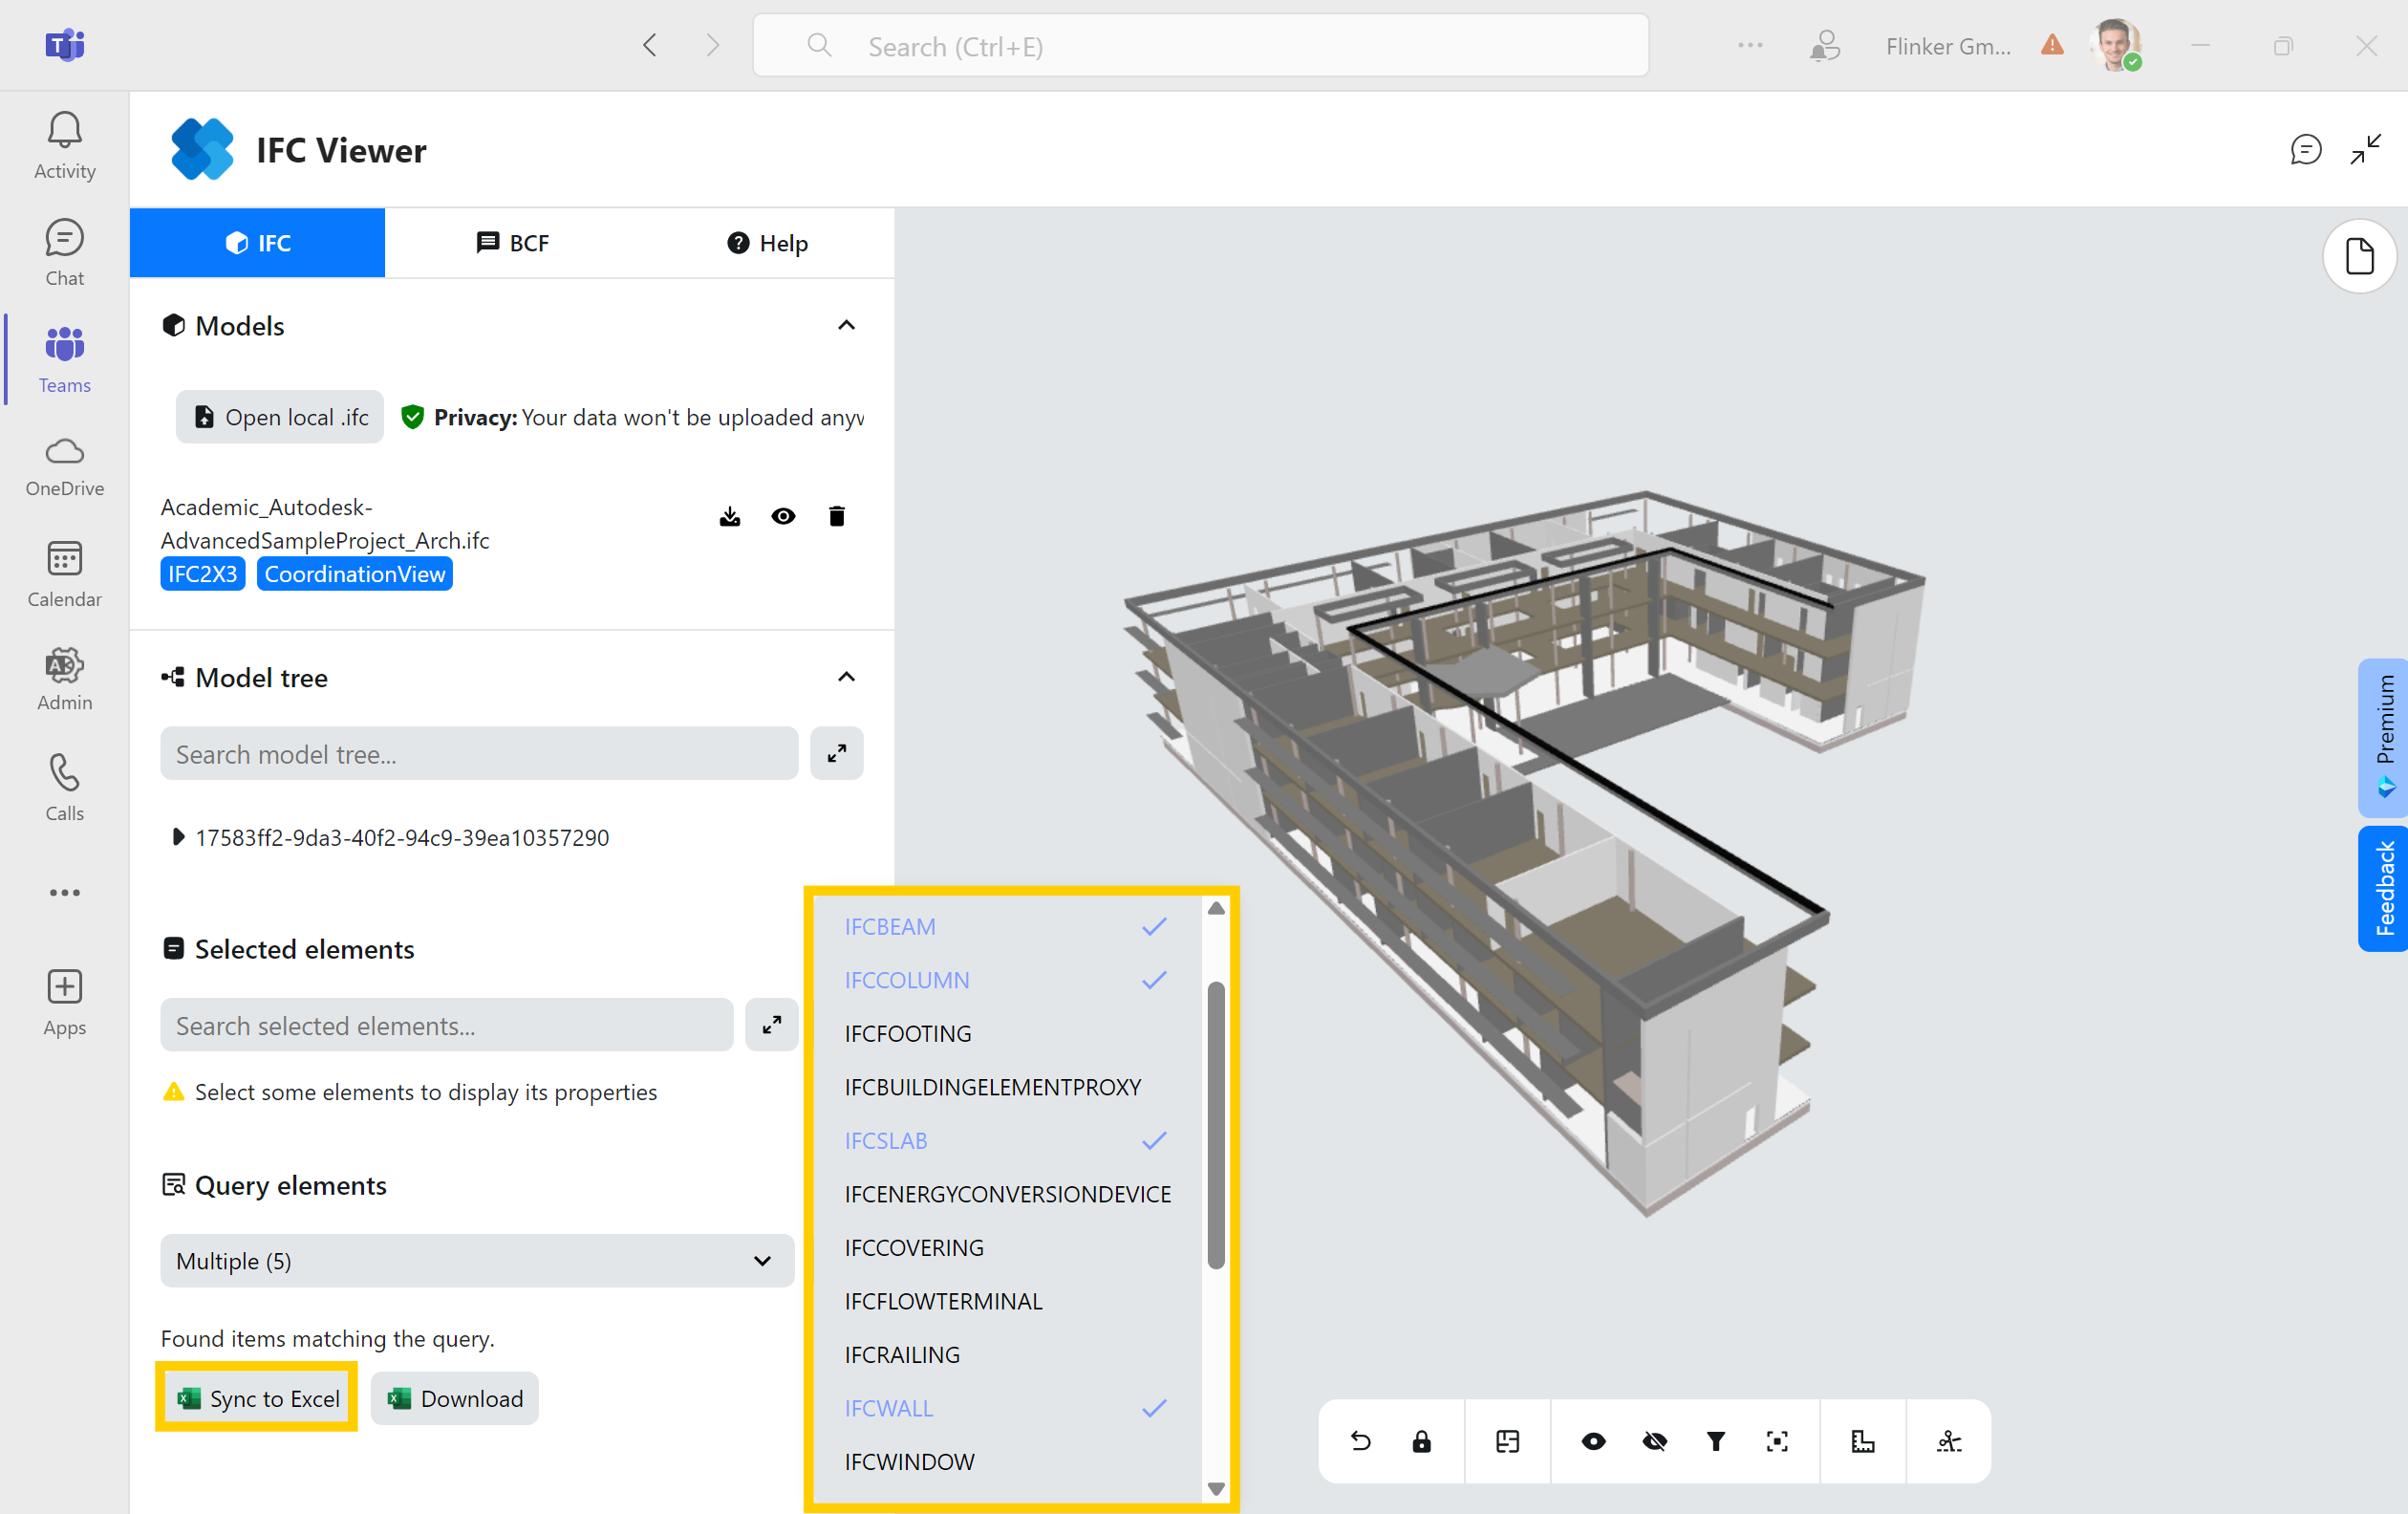
1. Query IFC categories
Start by querying the relevant IFC categories (such as IFCBeam, IFCColumn, IFCSlab, IFCWall) from your BIM environment. Make sure you have exported these categories to Excel or can sync them directly.
2. Open the Excel file location
Access the Excel file containing the queried IFC properties by clicking the provided link. Open the folder where the Excel file containing your IFC properties was generated or updated.
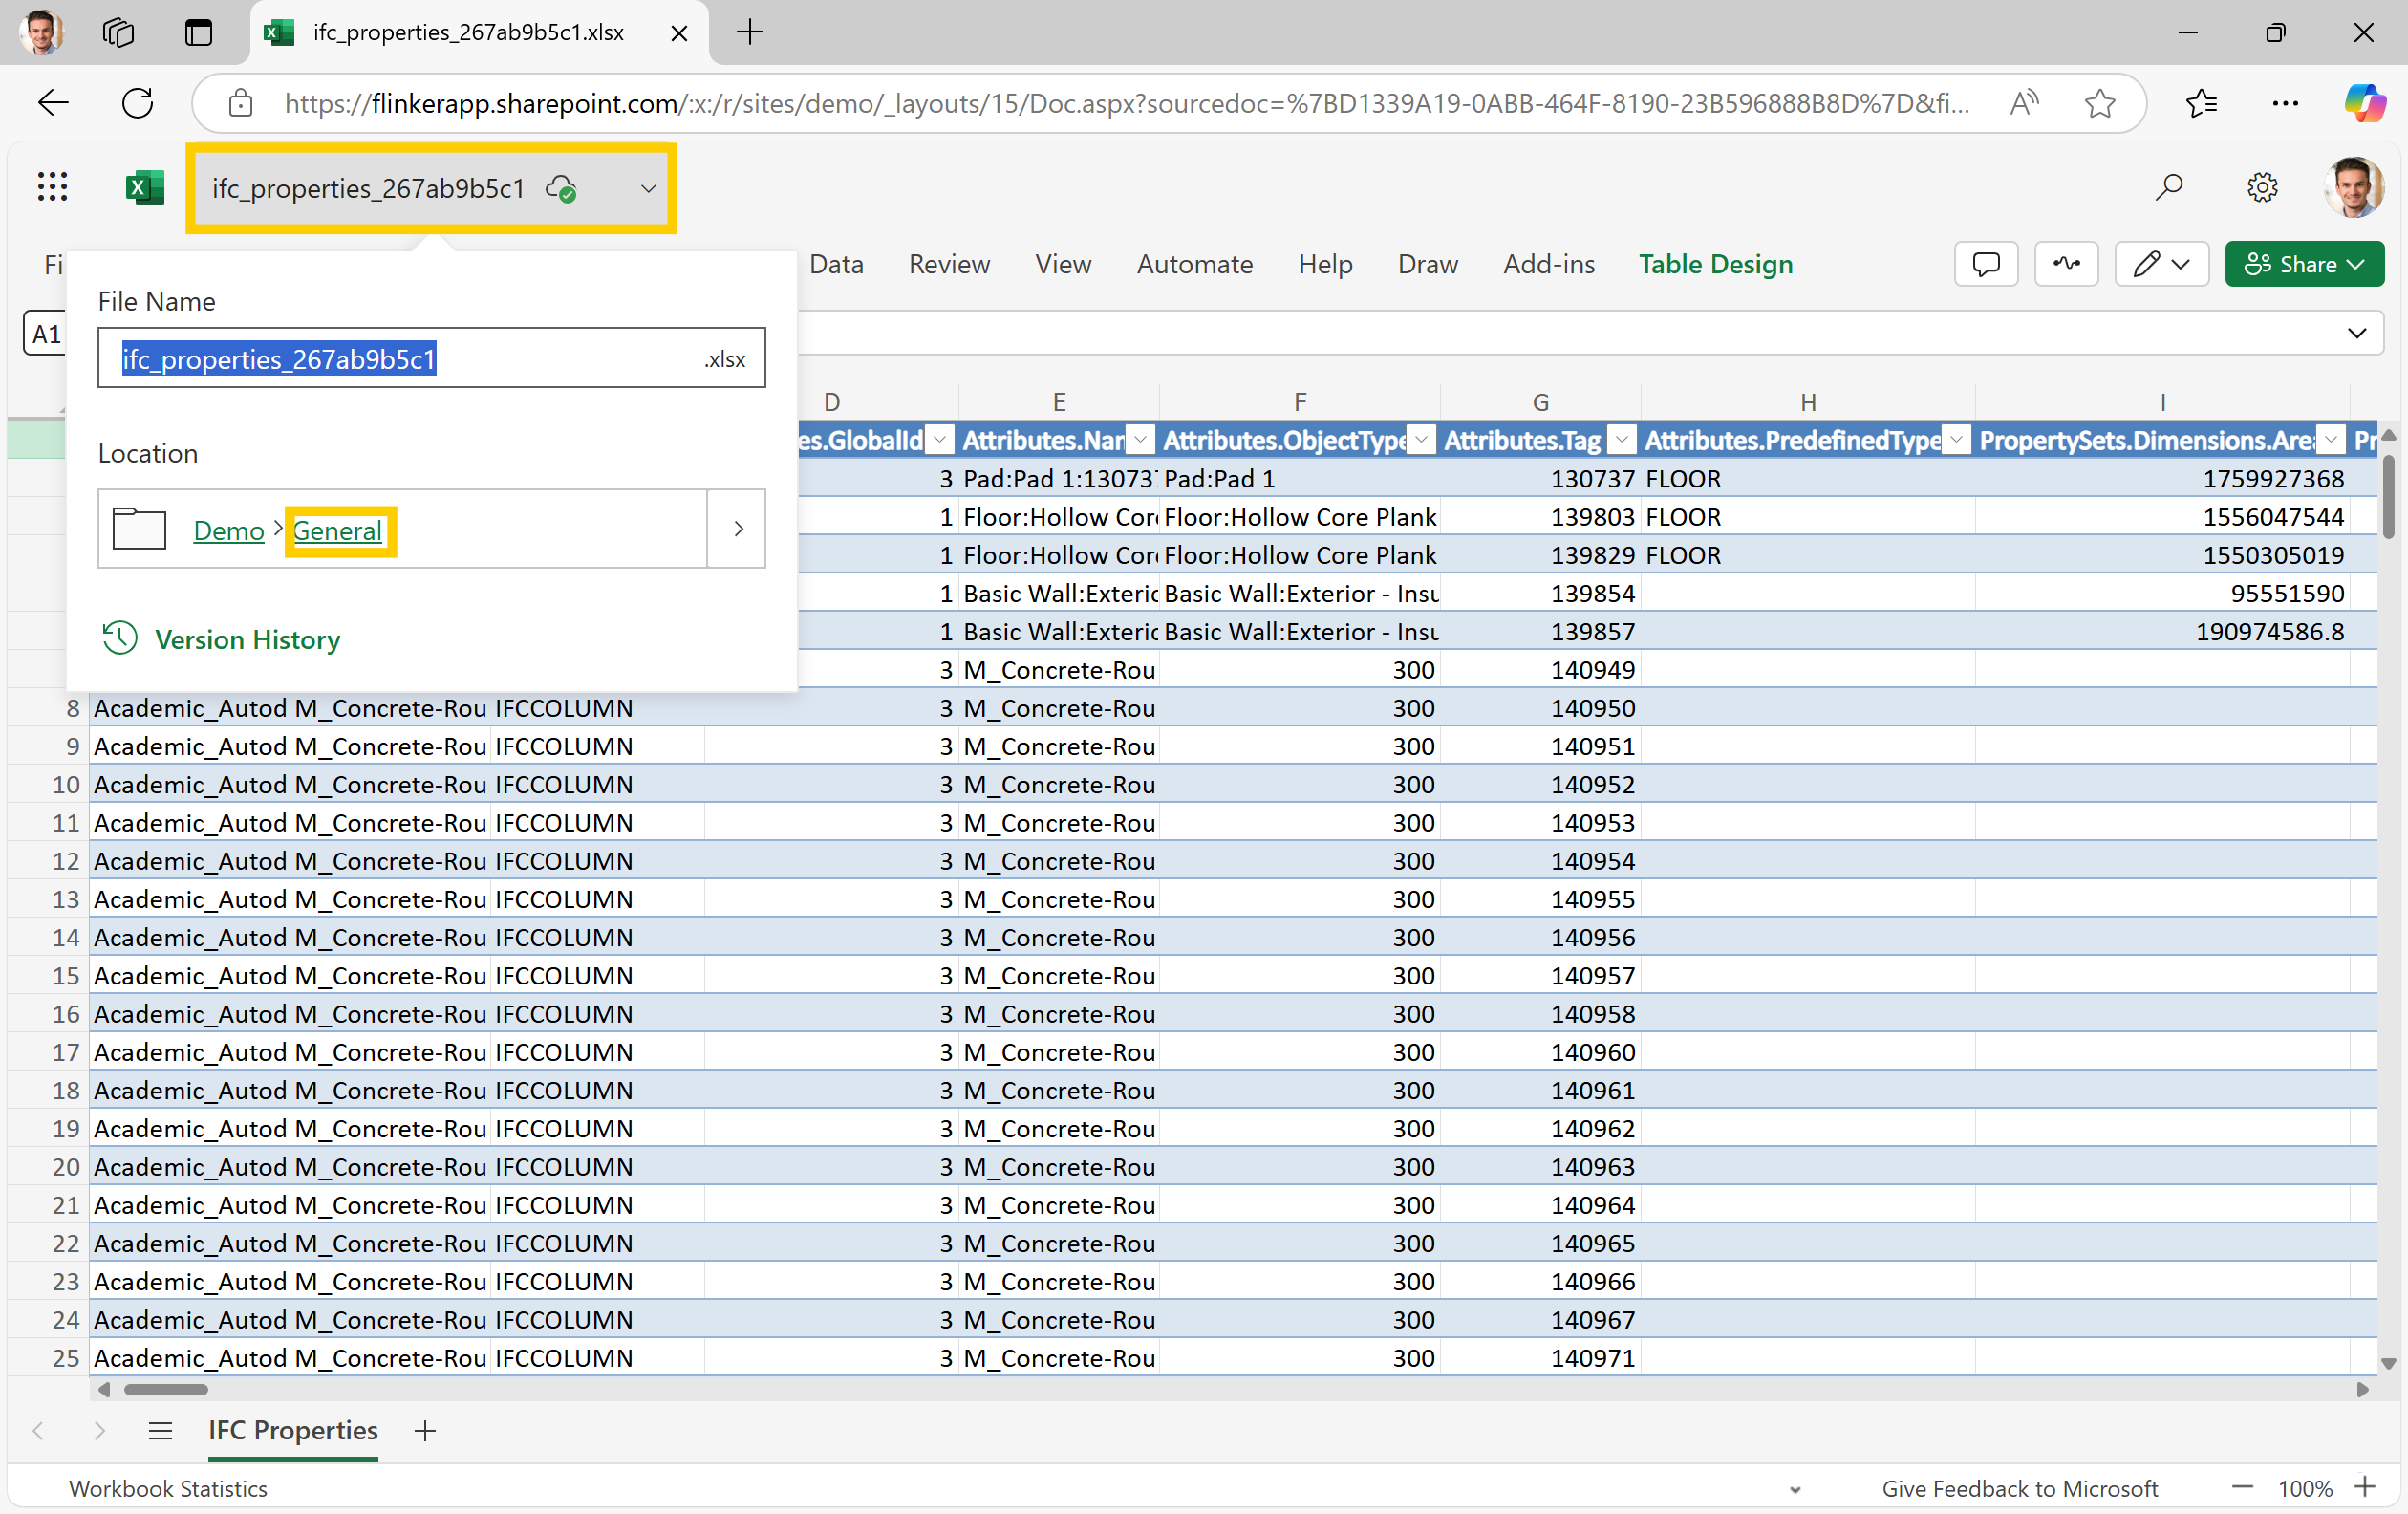
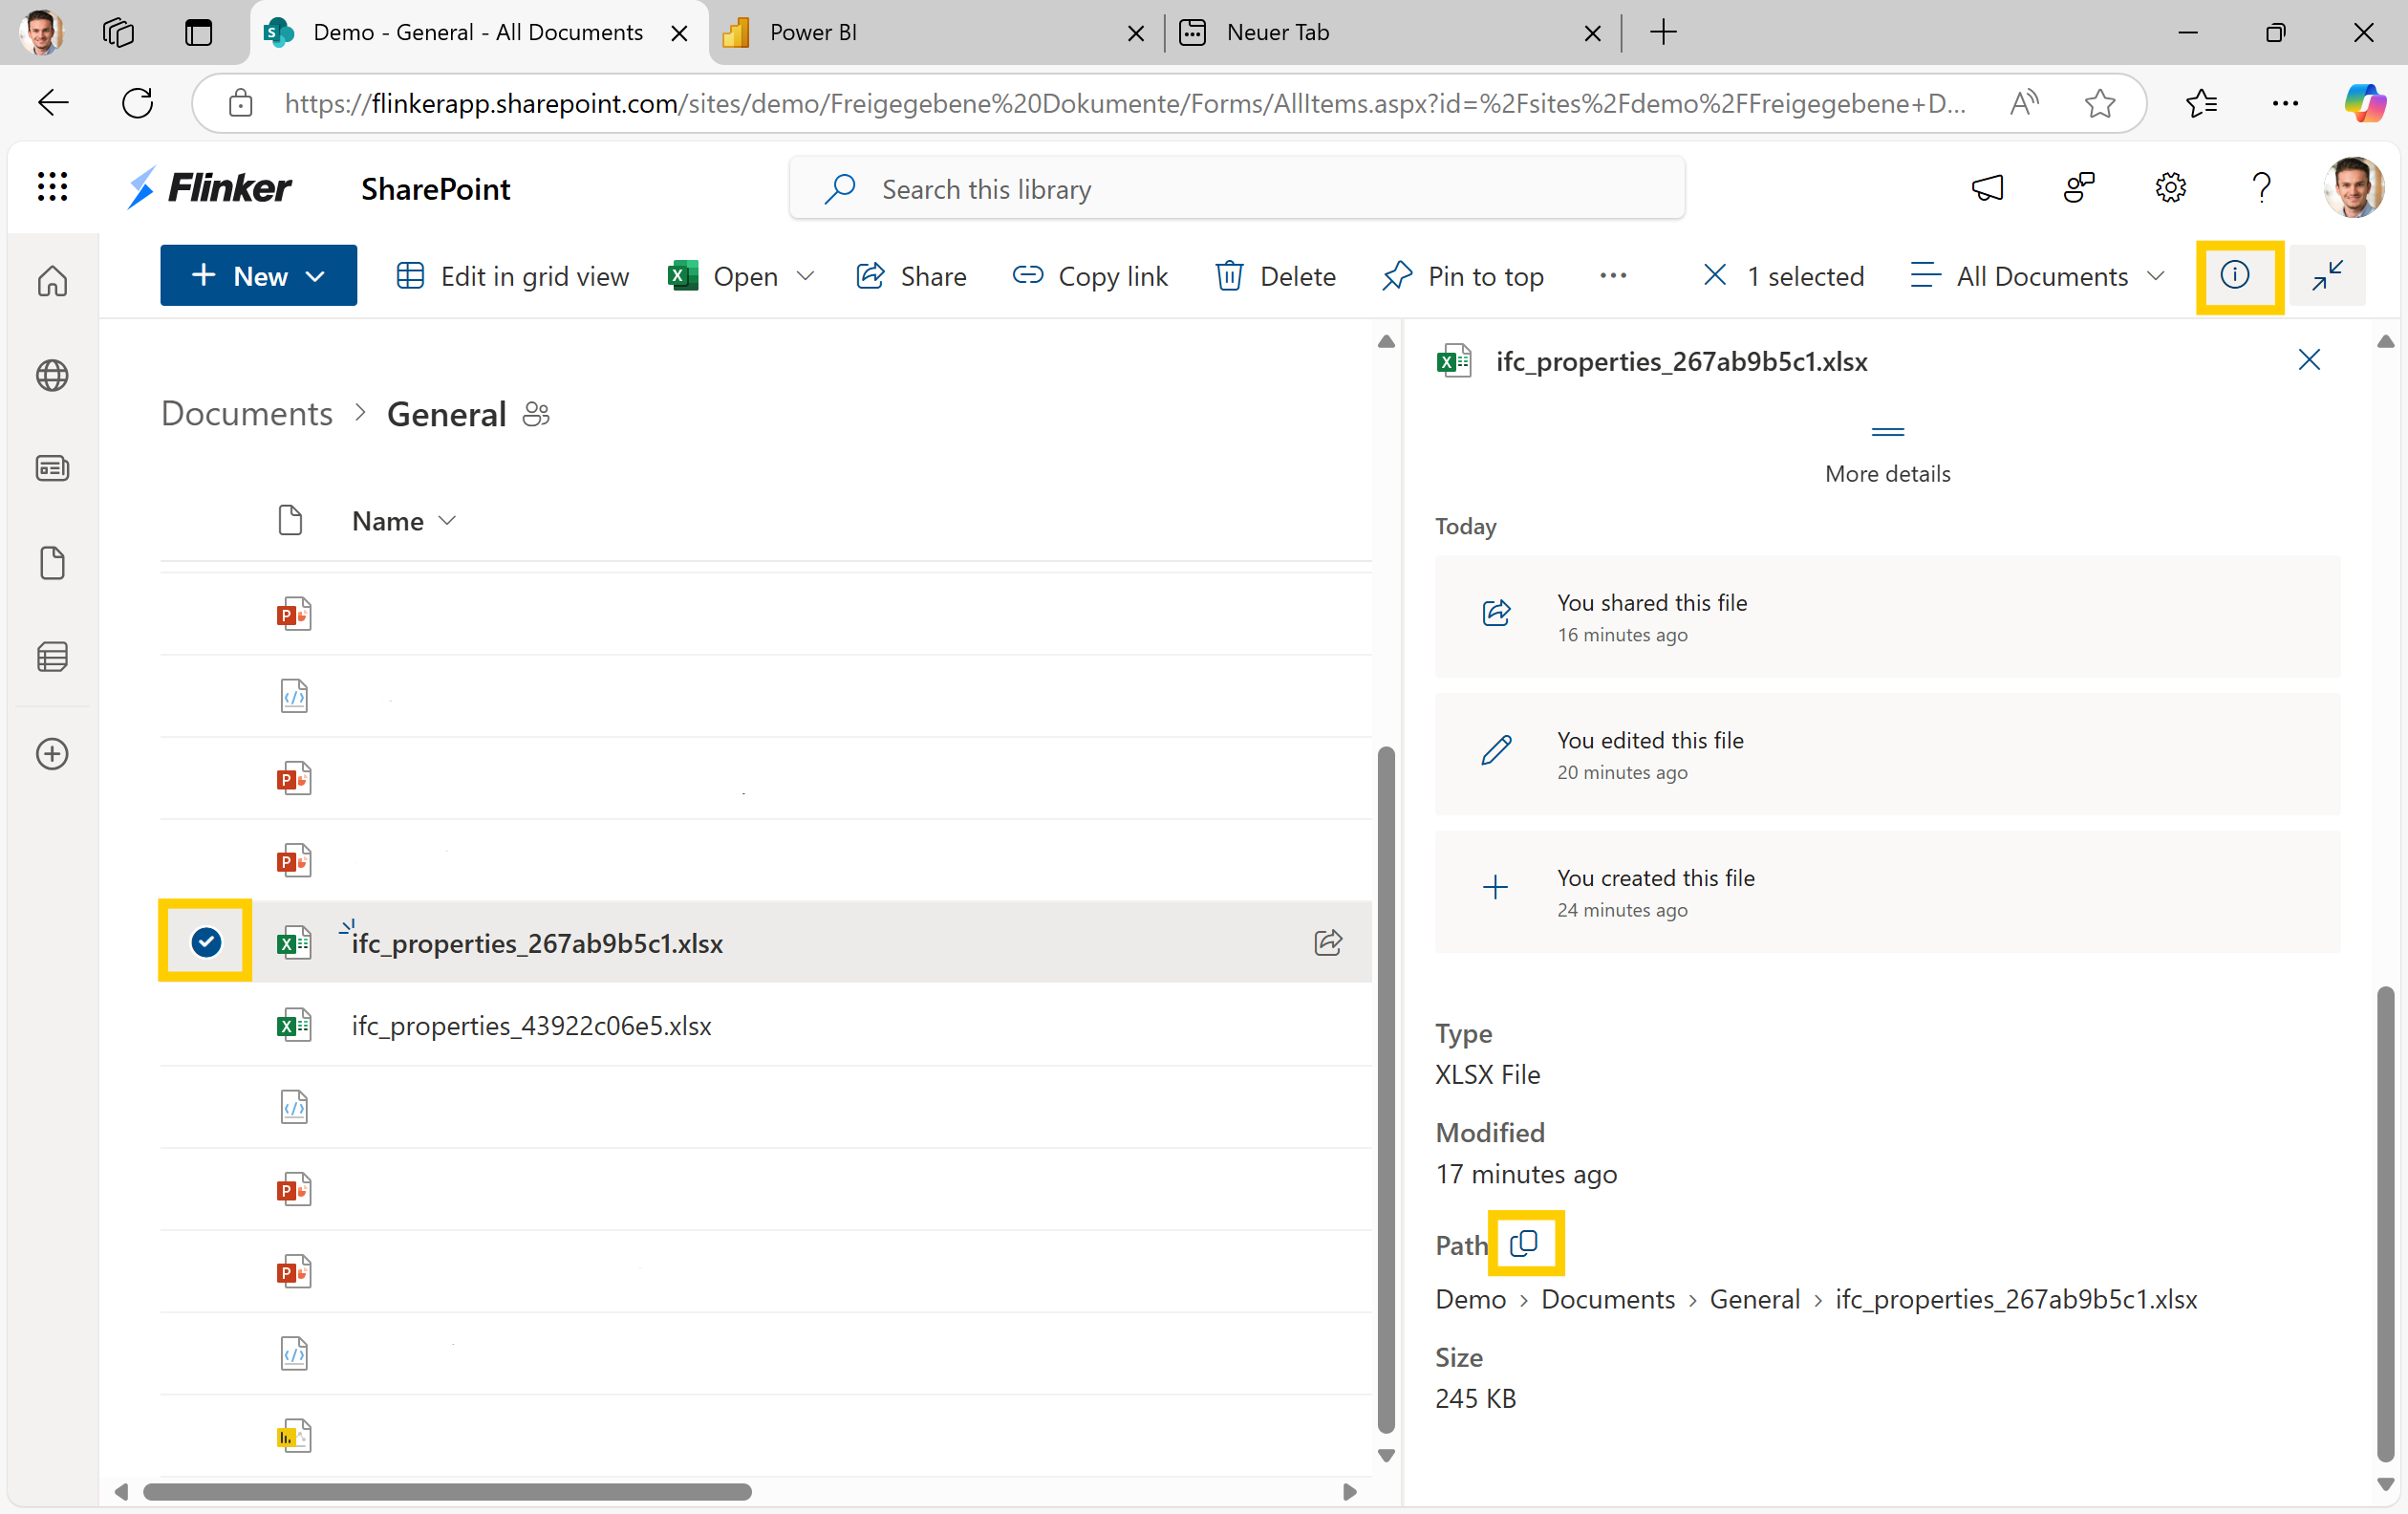
3. Select the Excel file and copy the direct link
In your SharePoint Online, select the Excel file and copy its direct link. This link will be used to connect Power BI to your IFC data source.
4. Open Power BI and start a new report
Open your web browser and navigate to the Power BI web app. Sign in with your organizational credentials. From the main Power BI workspace, start by creating a new report.
5. Choose Excel as the data source
Within Power BI, click on New Report and select Excel as your data source to begin connecting your IFC properties from the Excel file.

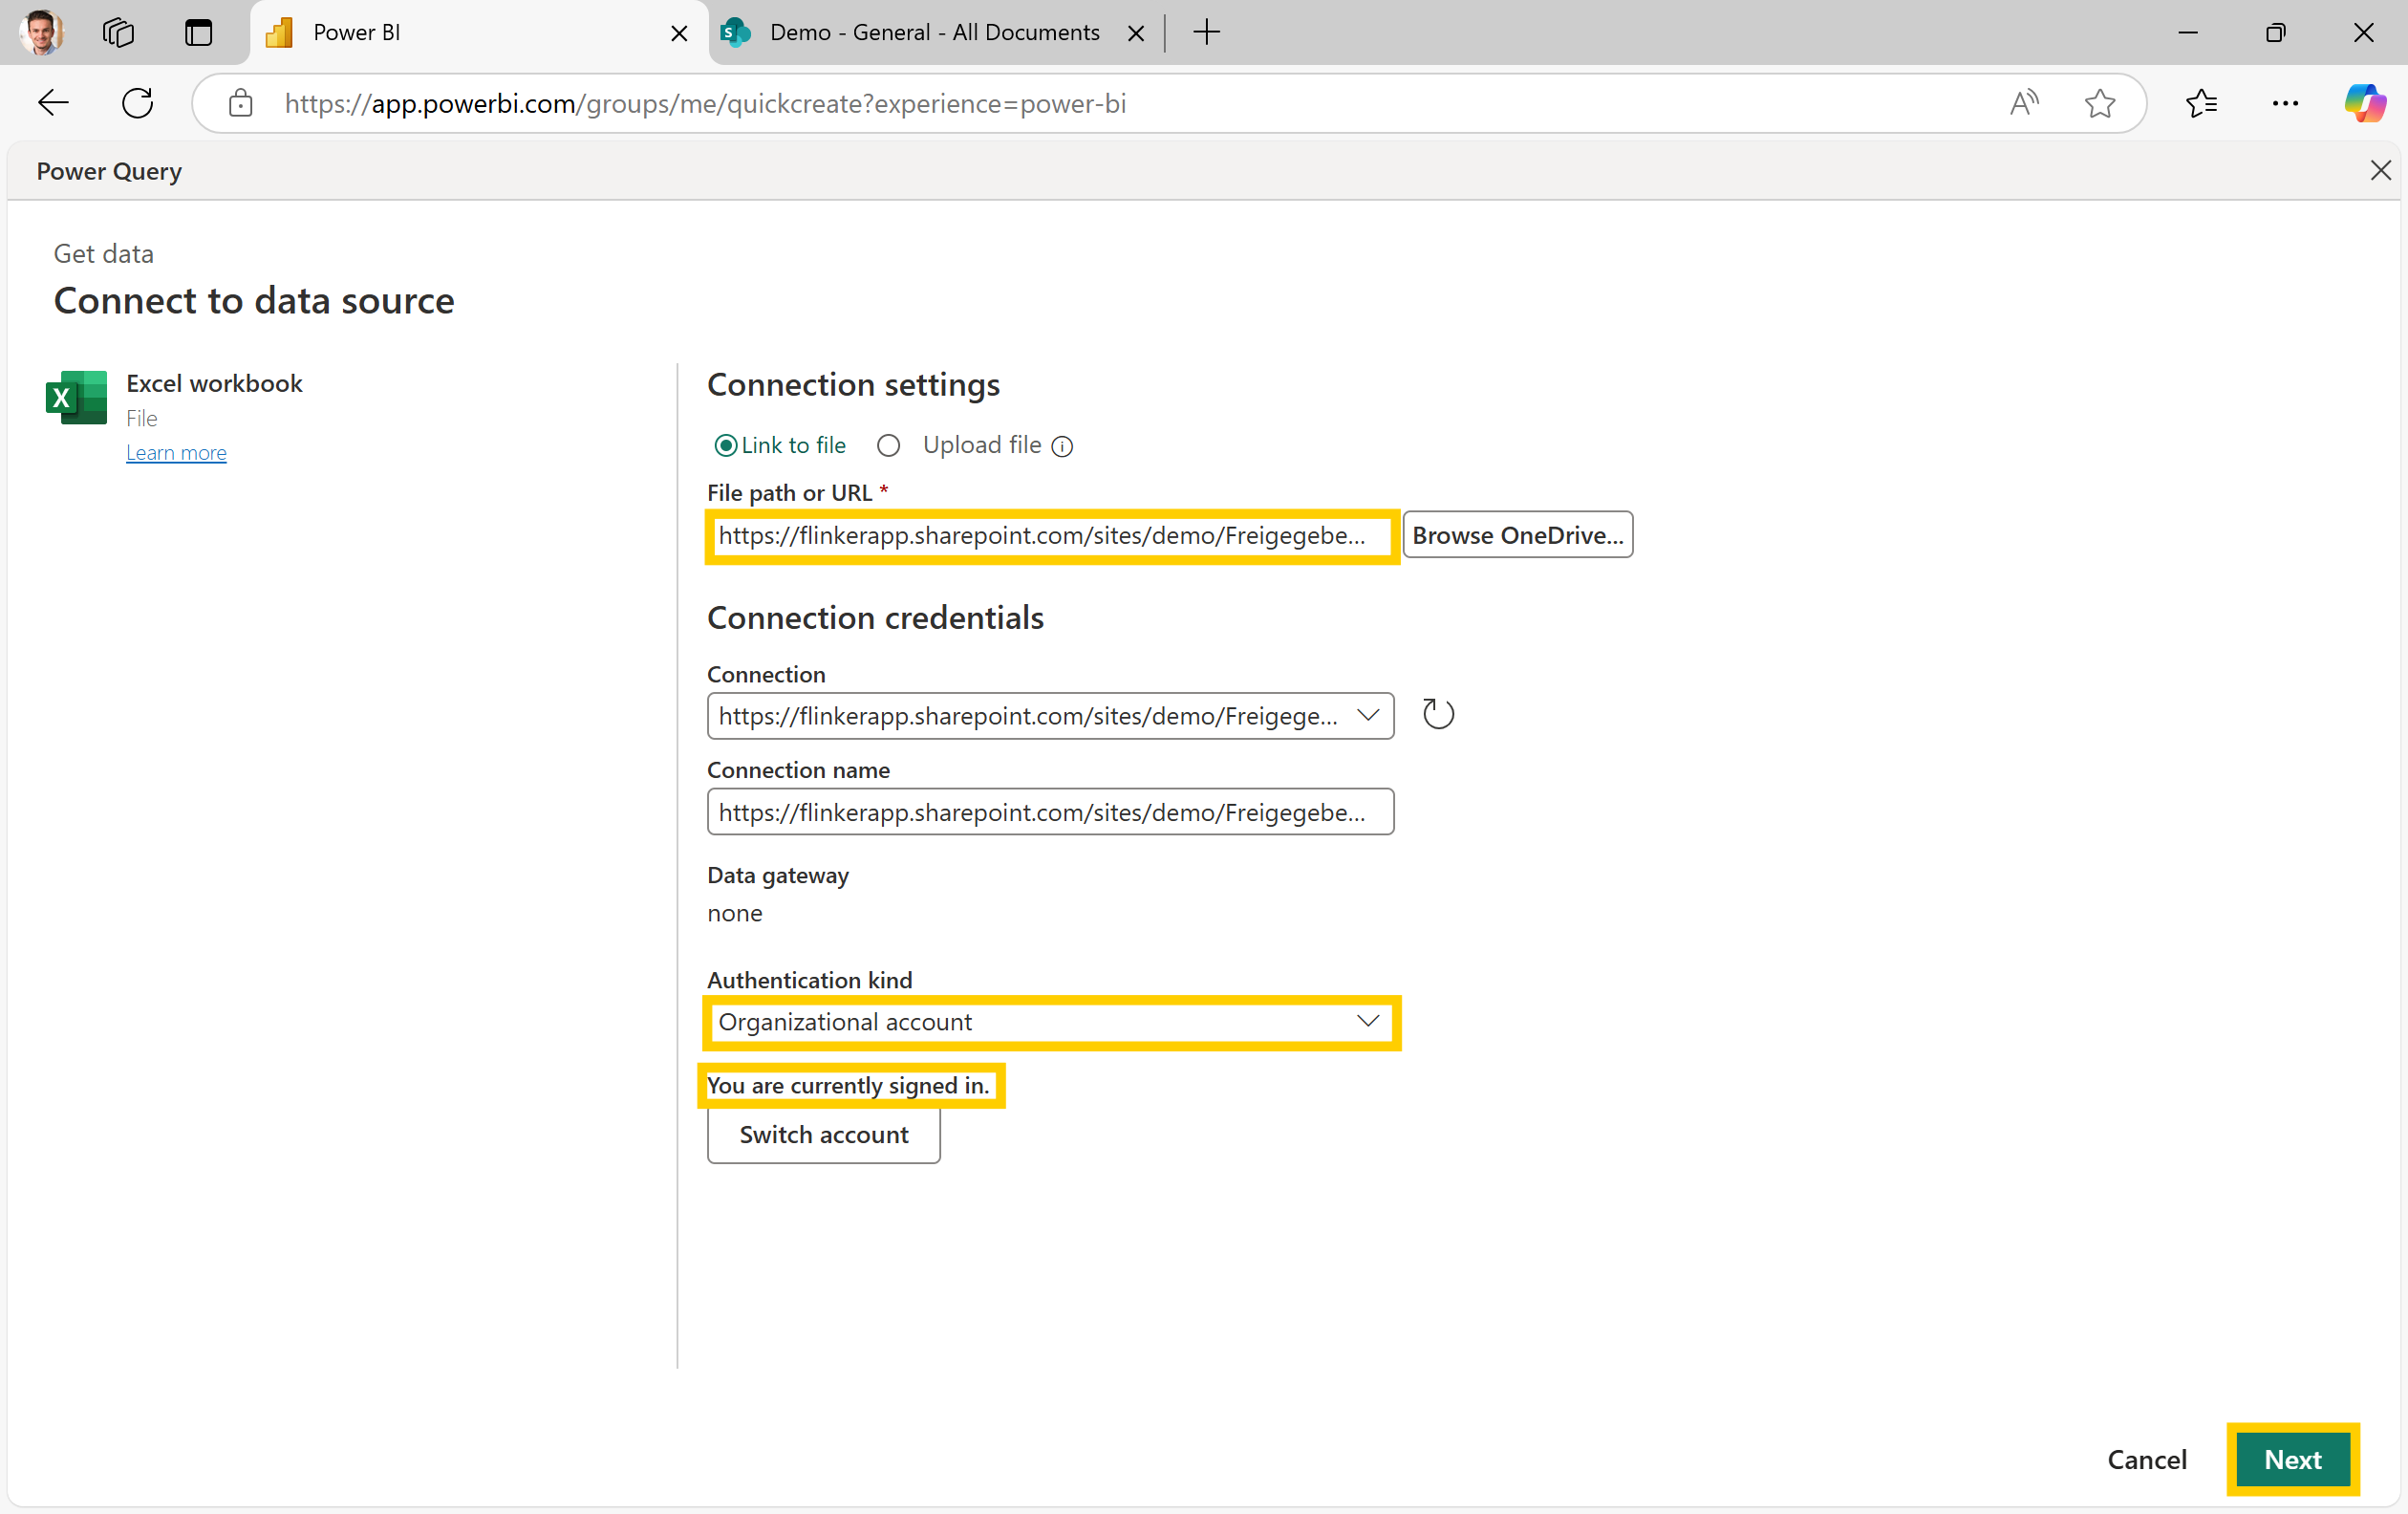
6. Paste the Excel link into Power BI
When prompted, paste the direct link to the IFC properties Excel file you previously copied. Sign in with your organizational account if required.
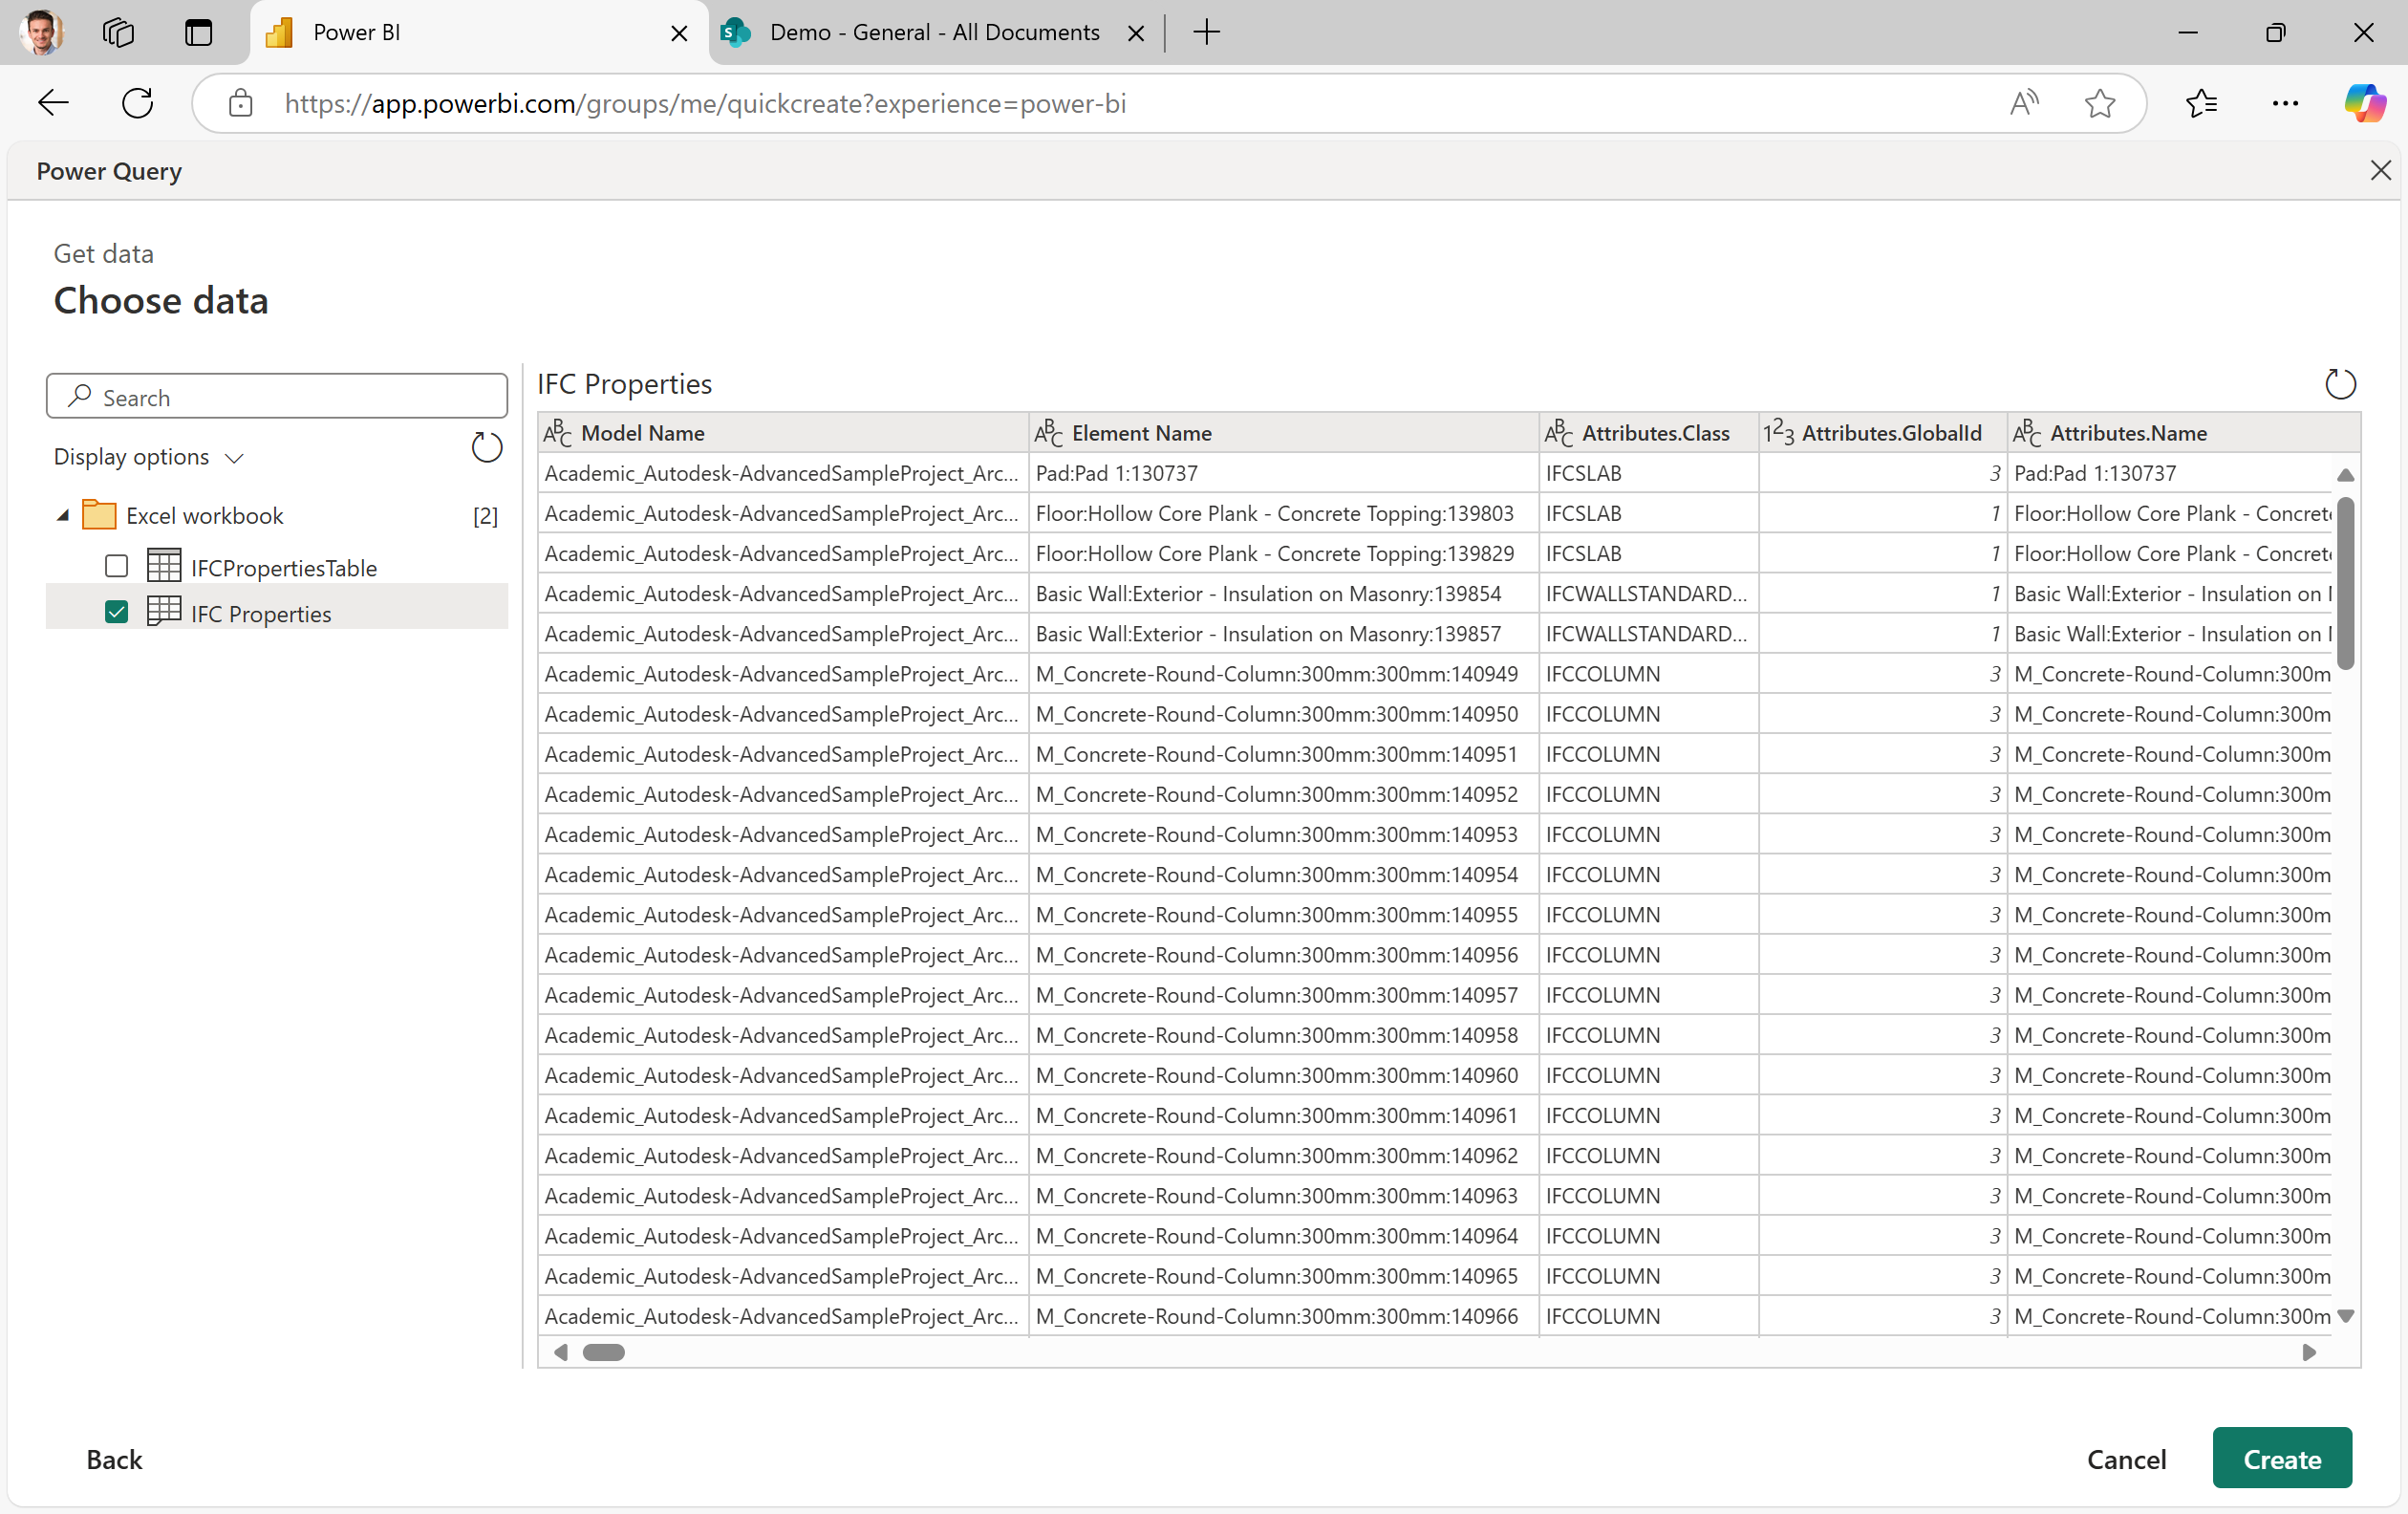
7. Choose your IFC data
Select the appropriate table (e.g., IFCProperties) that contains the IFC data you need and click Create to load it into Power BI.
8. Confirm your data is loaded
Verify that your IFC properties data is now loaded into the Power BI report. You should see all the relevant fields and columns ready for analysis and visualization.
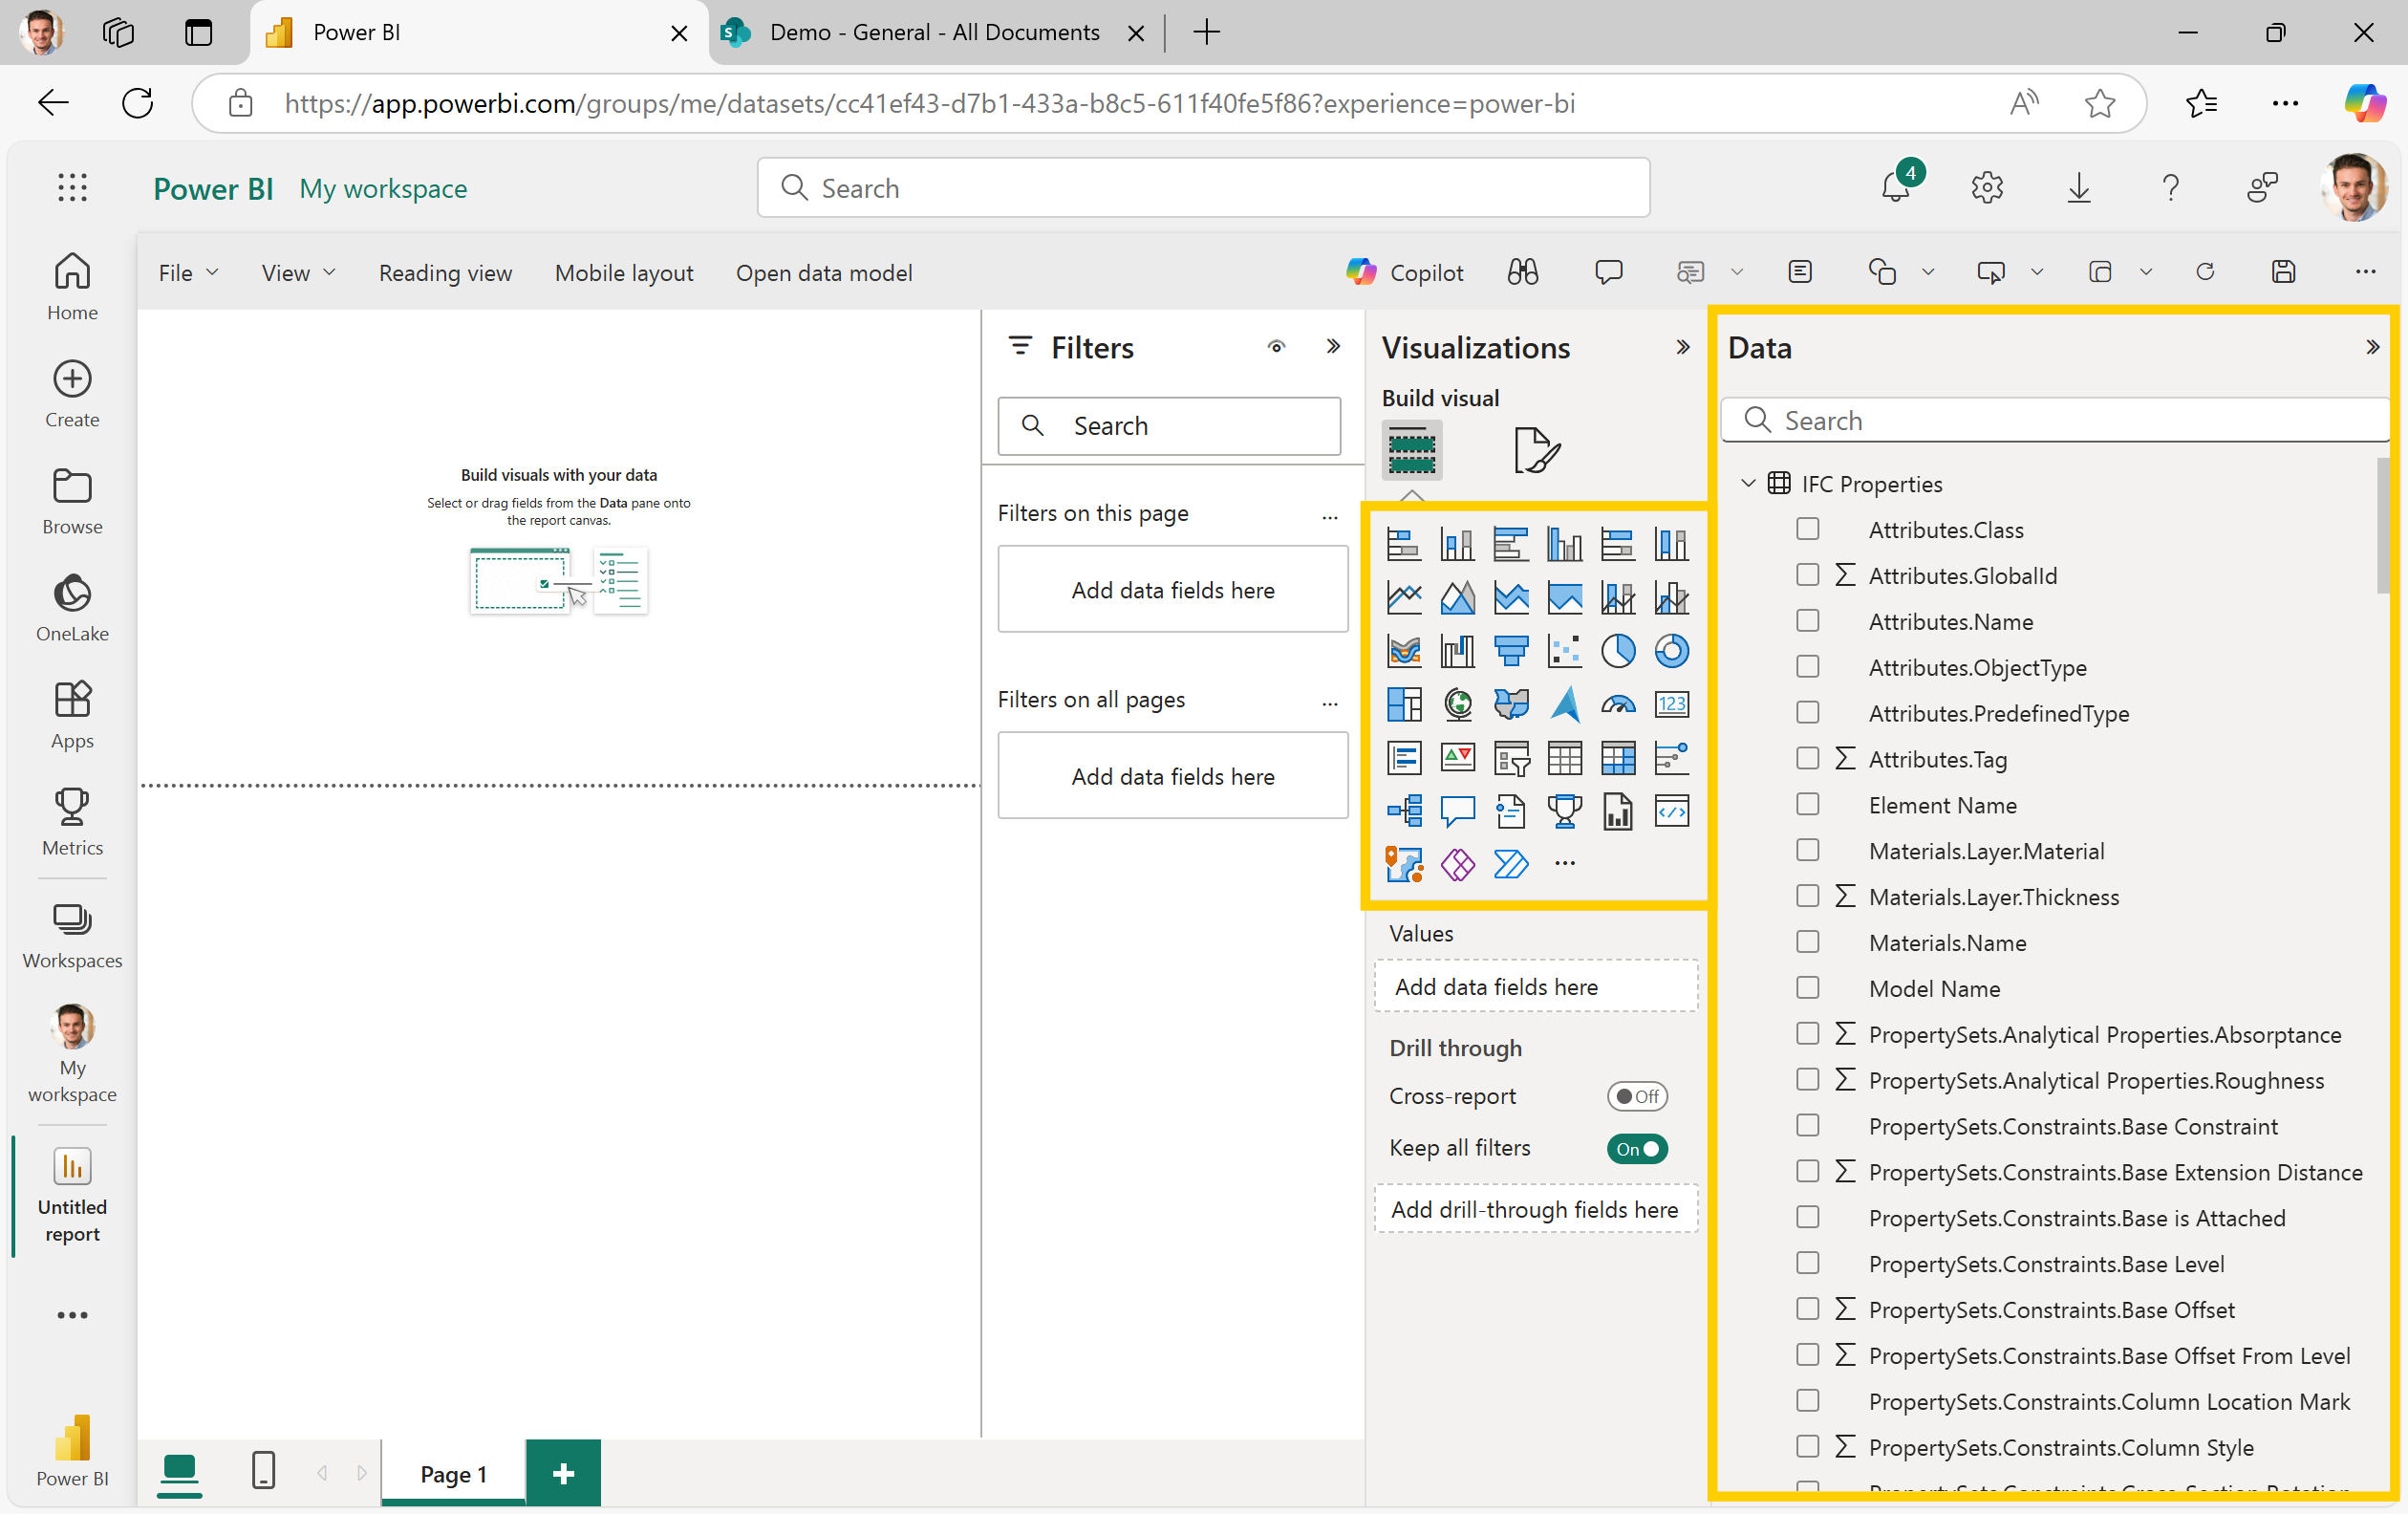
9. Create BIM data visualizations in Power BI
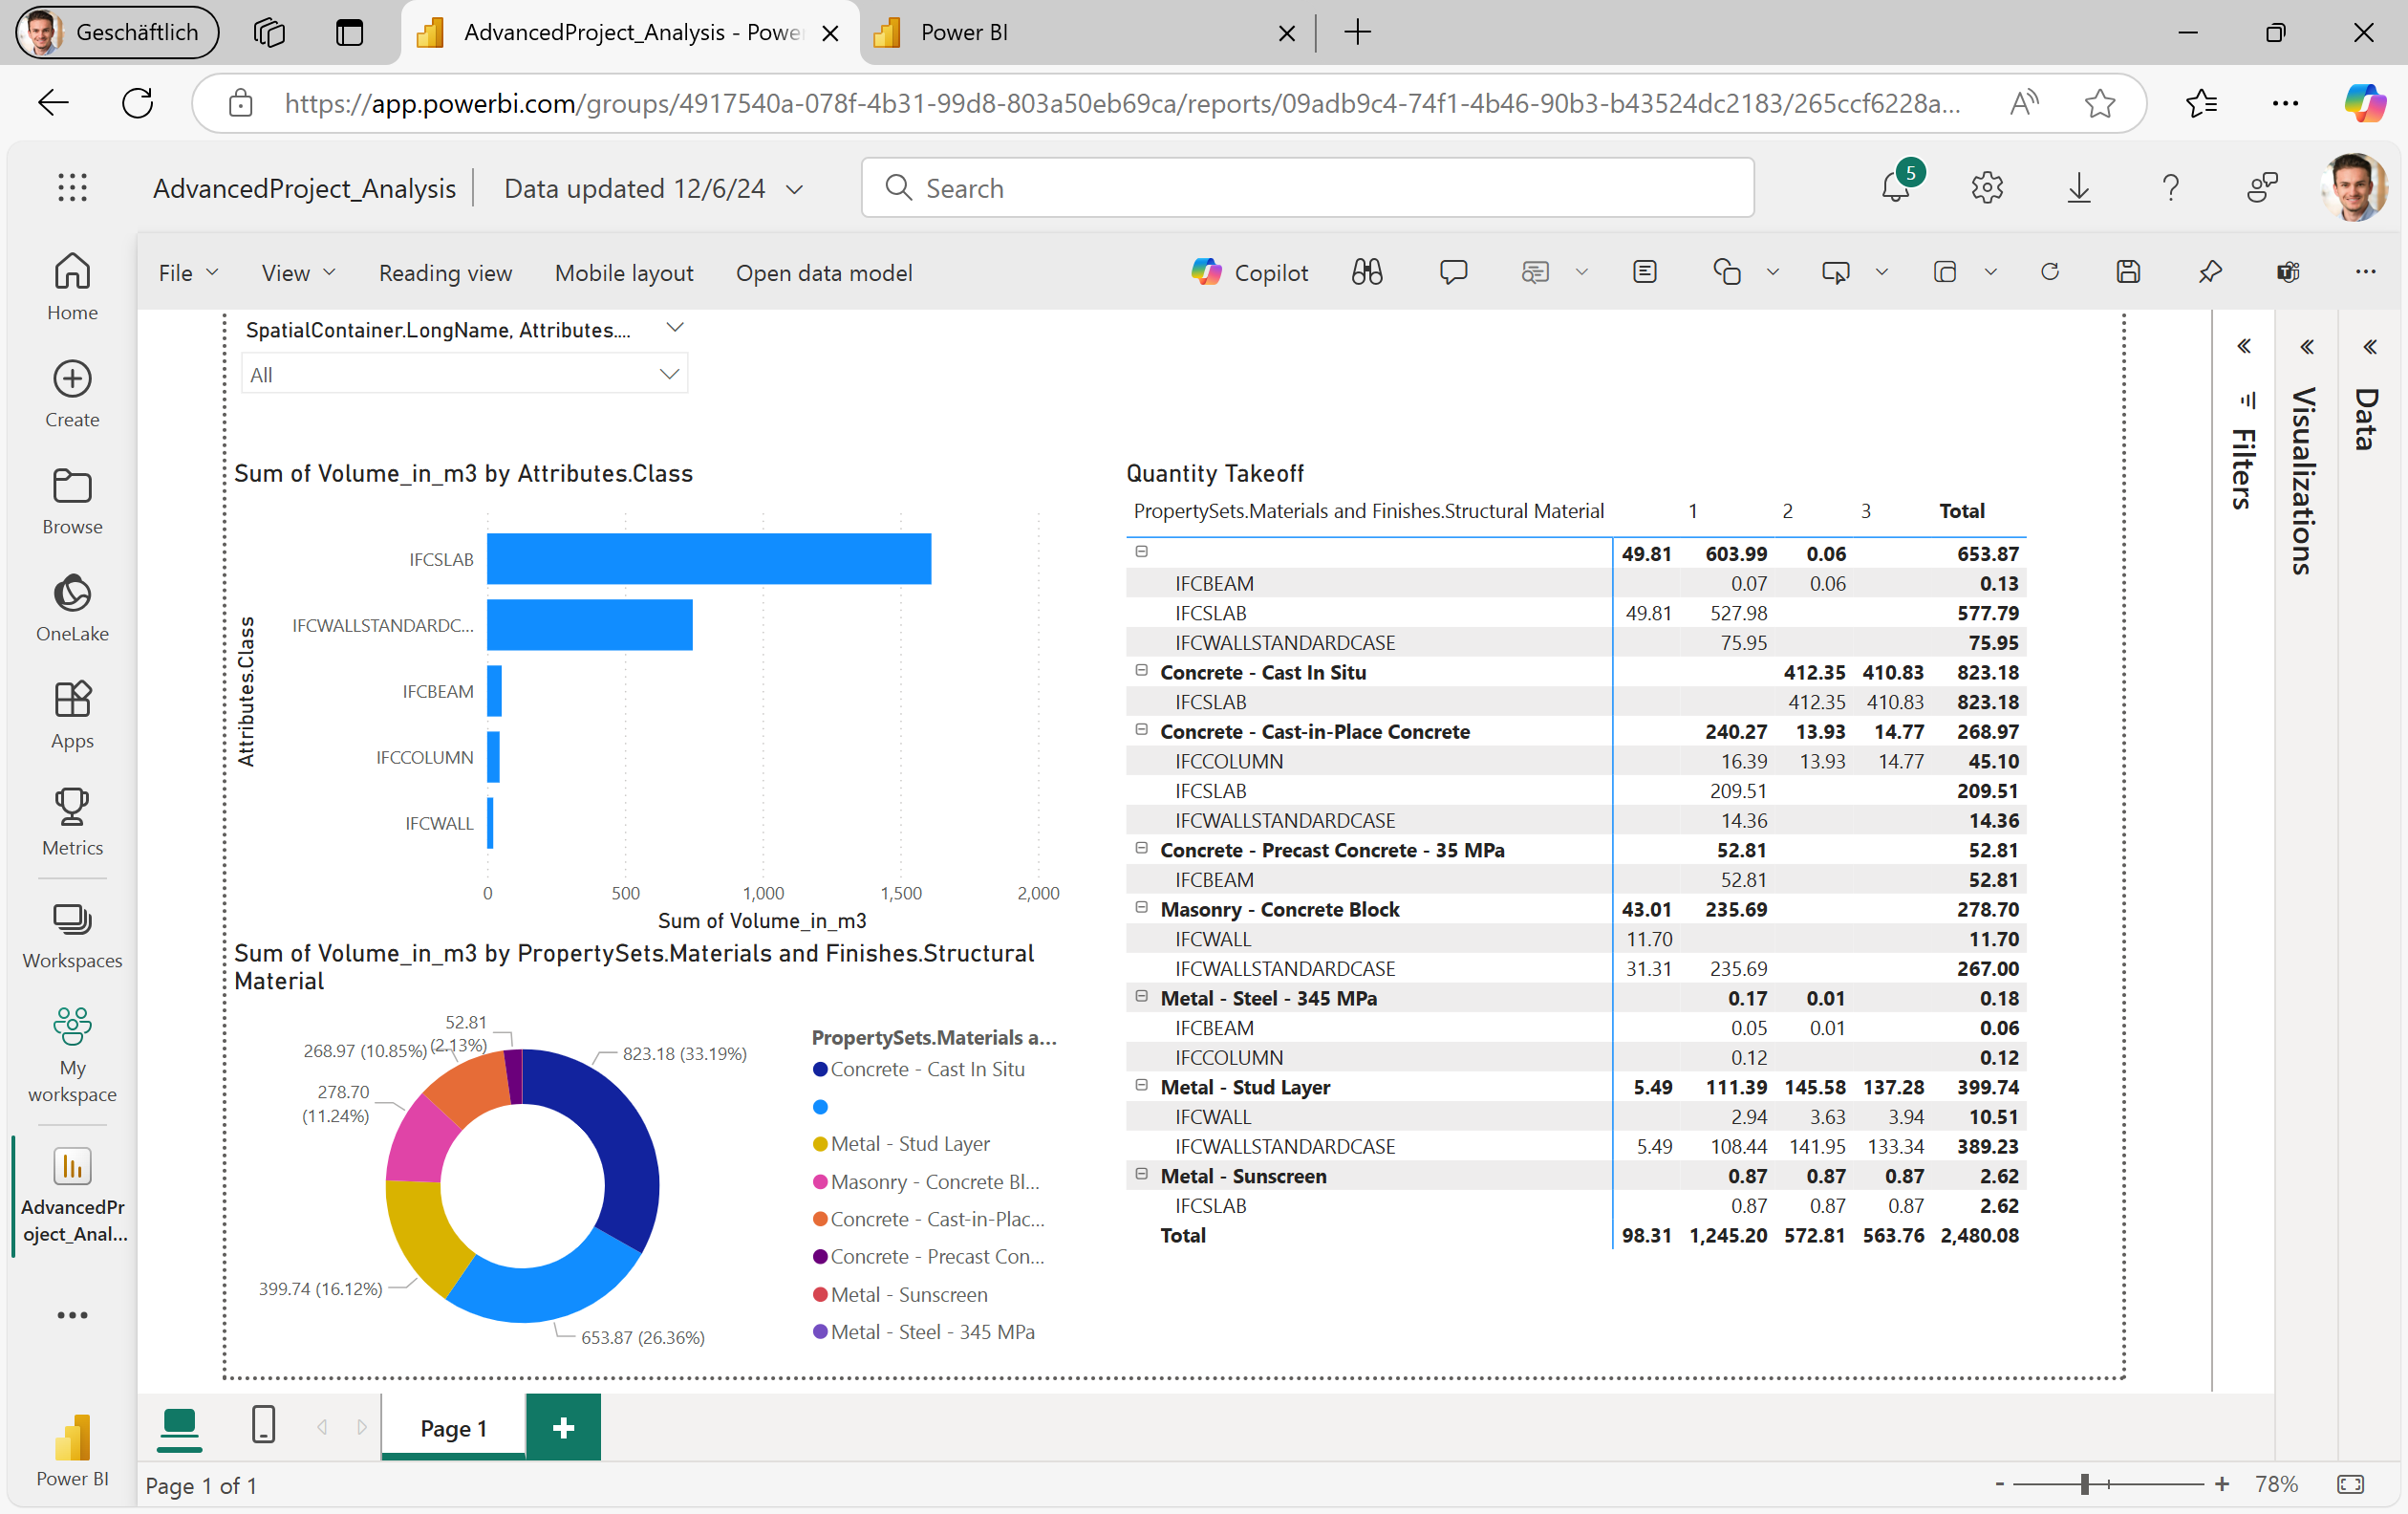
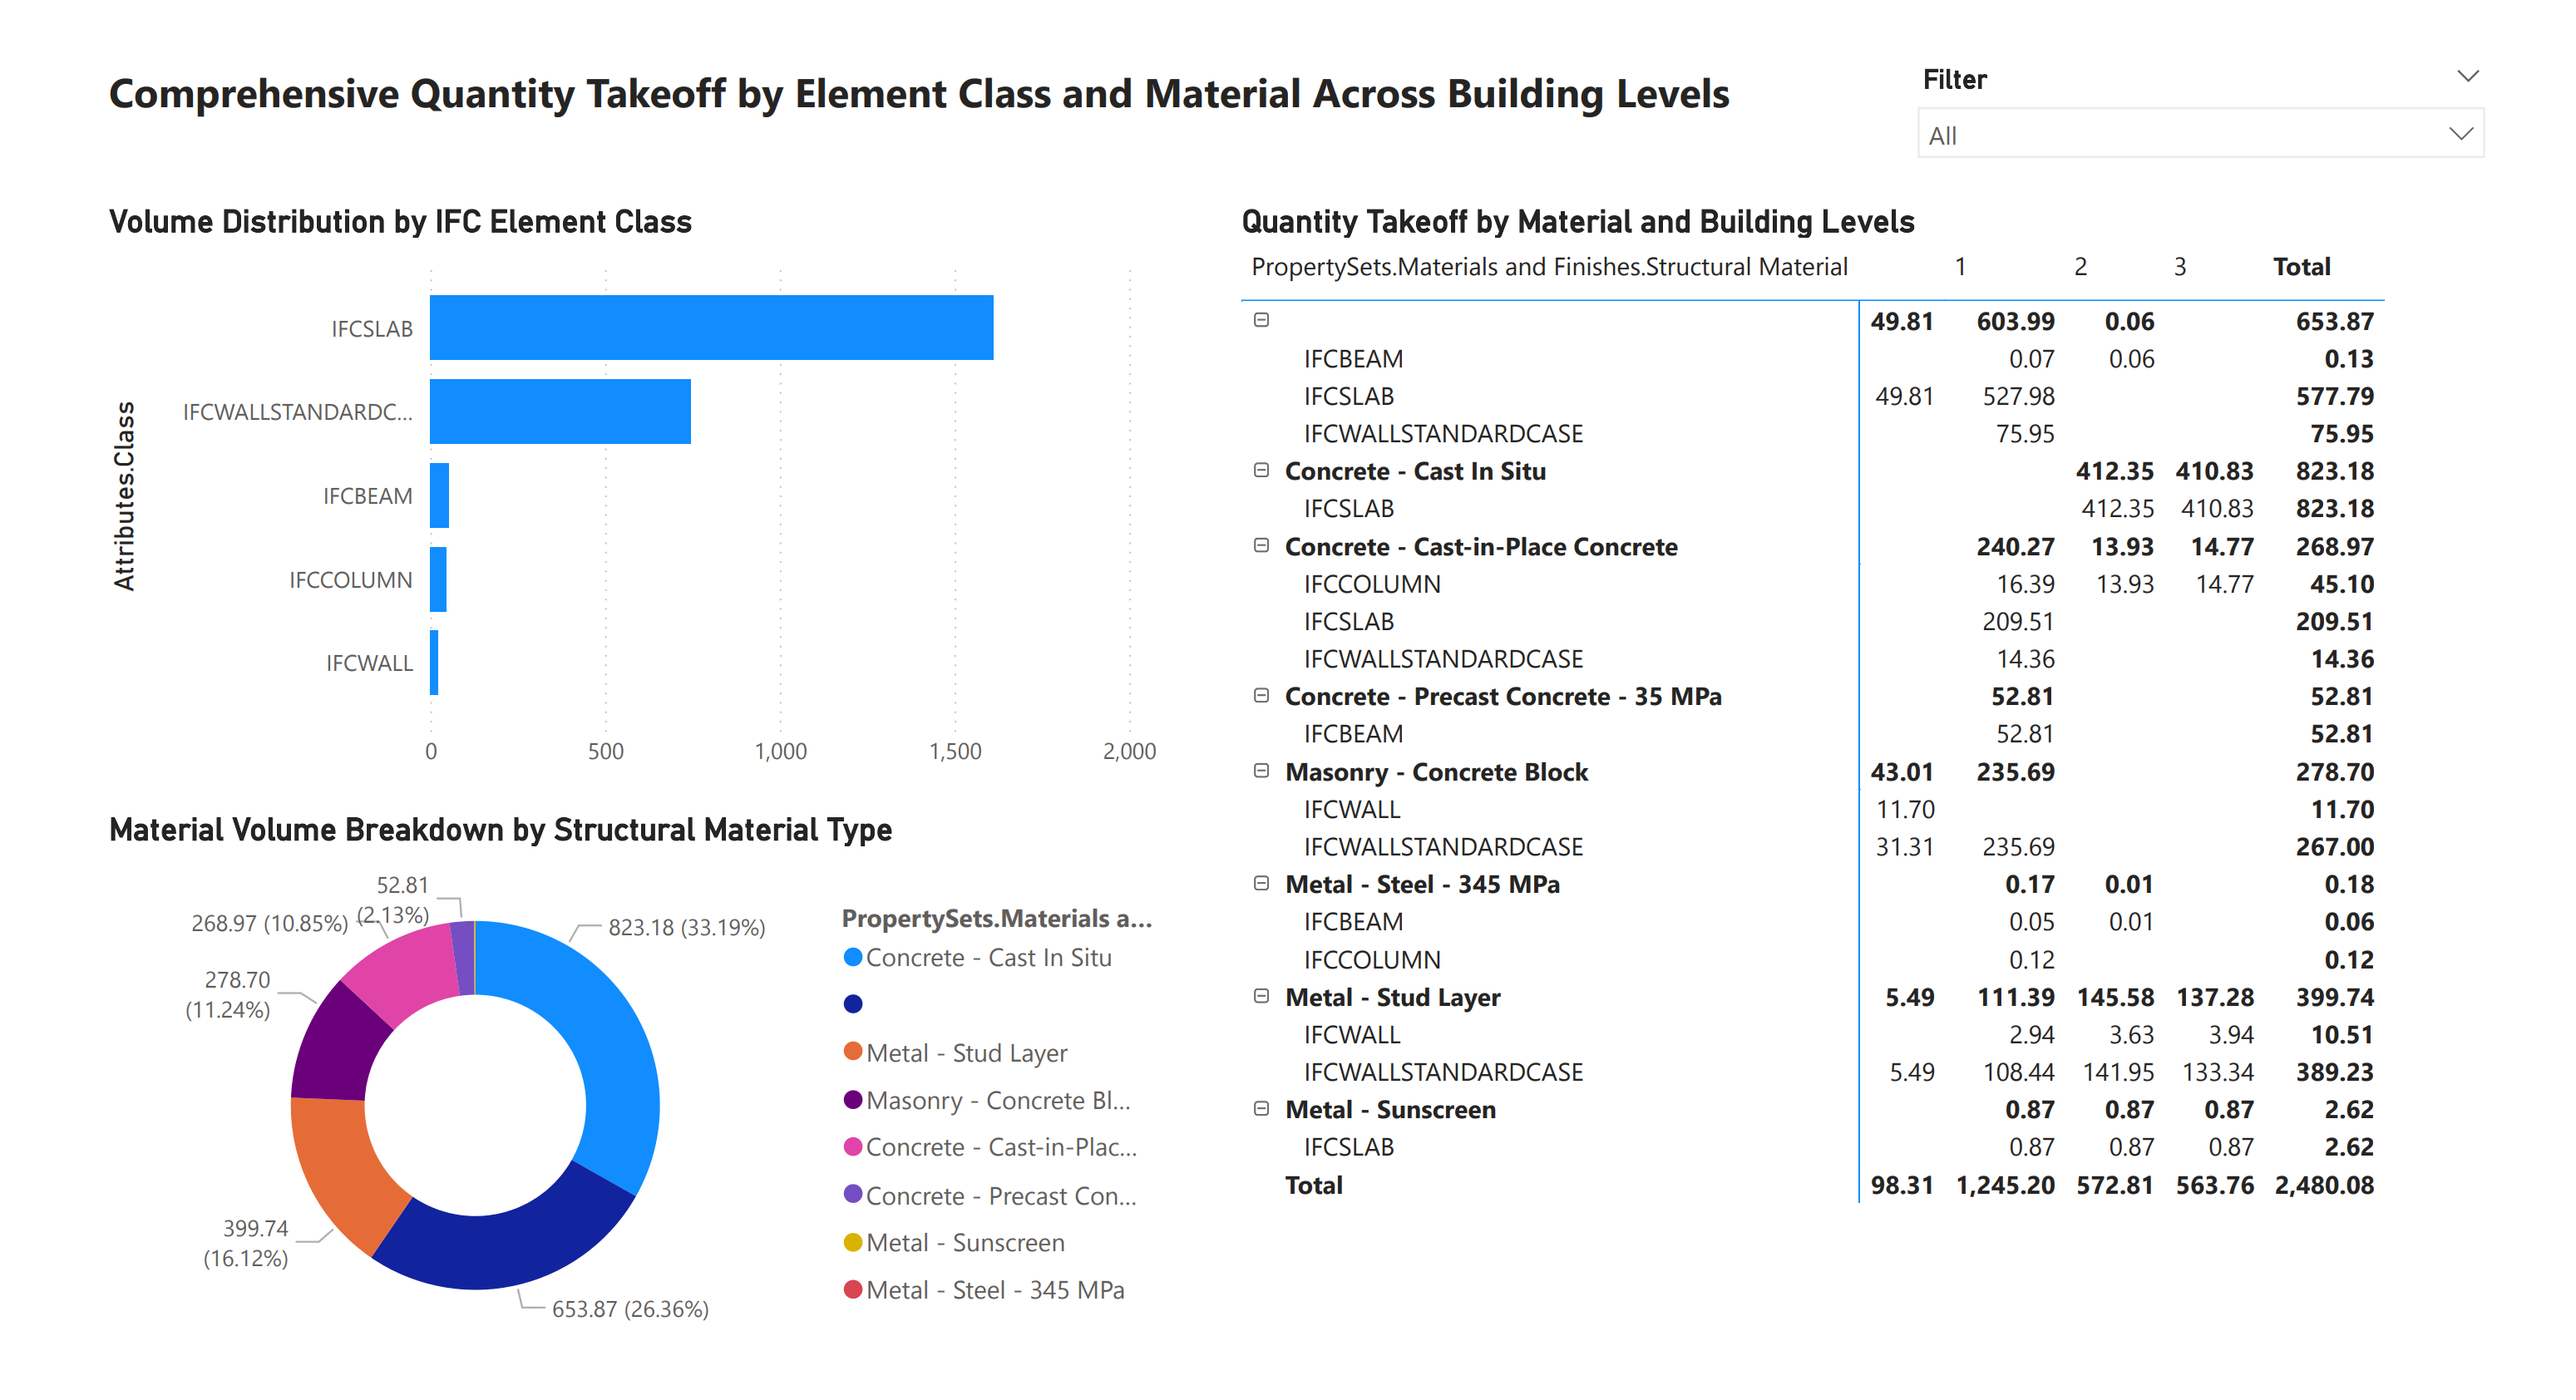
After loading your IFC-based fields (e.g., Attributes.Class, Volume_in_m3, PropertySets.Materials_and_Finishes.Structural_Material) into Power BI, create visuals to analyze construction elements and materials:
Horizontal Bar Chart (Volume by IFC Class):
- Select the Bar Chart visual.
- Add
Attributes.Classto the Axis, andVolume_in_m3to Values (summed). - Compare volumes of IFC classes (IFCBEAM, IFCSLAB, IFCWALLSTANDARDCASE) at a glance.
Donut Chart (Material Composition):
- Choose the Donut Chart visual.
- Place
PropertySets.Materials_and_Finishes.Structural_Materialin the Legend andVolume_in_m3in Values. - View the percentage split of materials (Concrete, Steel, Masonry) instantly.
Matrix Table (Hierarchical Quantity Takeoff):
- Insert a Matrix visual.
- Add
Attributes.Classto Rows,PropertySets.Materials_and_Finishes.Structural_Materialbeneath it for hierarchy, andVolume_in_m3to Values. - Drill down to detail-level quantities for each element-class and material combination.
These visuals turn raw IFC data into actionable insights, aiding in material planning, cost estimation, and overall BIM-based project decision-making.