Color IFC elements in the Power BI viewer
Conditional formatting lets you highlight model elements directly inside the IFC Viewer visual so that stakeholders can instantly see phases, disciplines, or QA findings. Power BI supports two conditional-formatting modes-pick the one that matches how you want to manage colors.
Option 1: Set colors manually
When to use manual colors
- You want to quickly highlight a few known categories without changing your data model.
- You prefer manual, one-off settings per report page or visual.
- You have a small, stable list of values (e.g., 3–6 types or statuses).
- You’re doing ad‑hoc demos where speed matters more than reusability.
How to set manual colors
- Select the IFC Viewer visual on your report canvas.
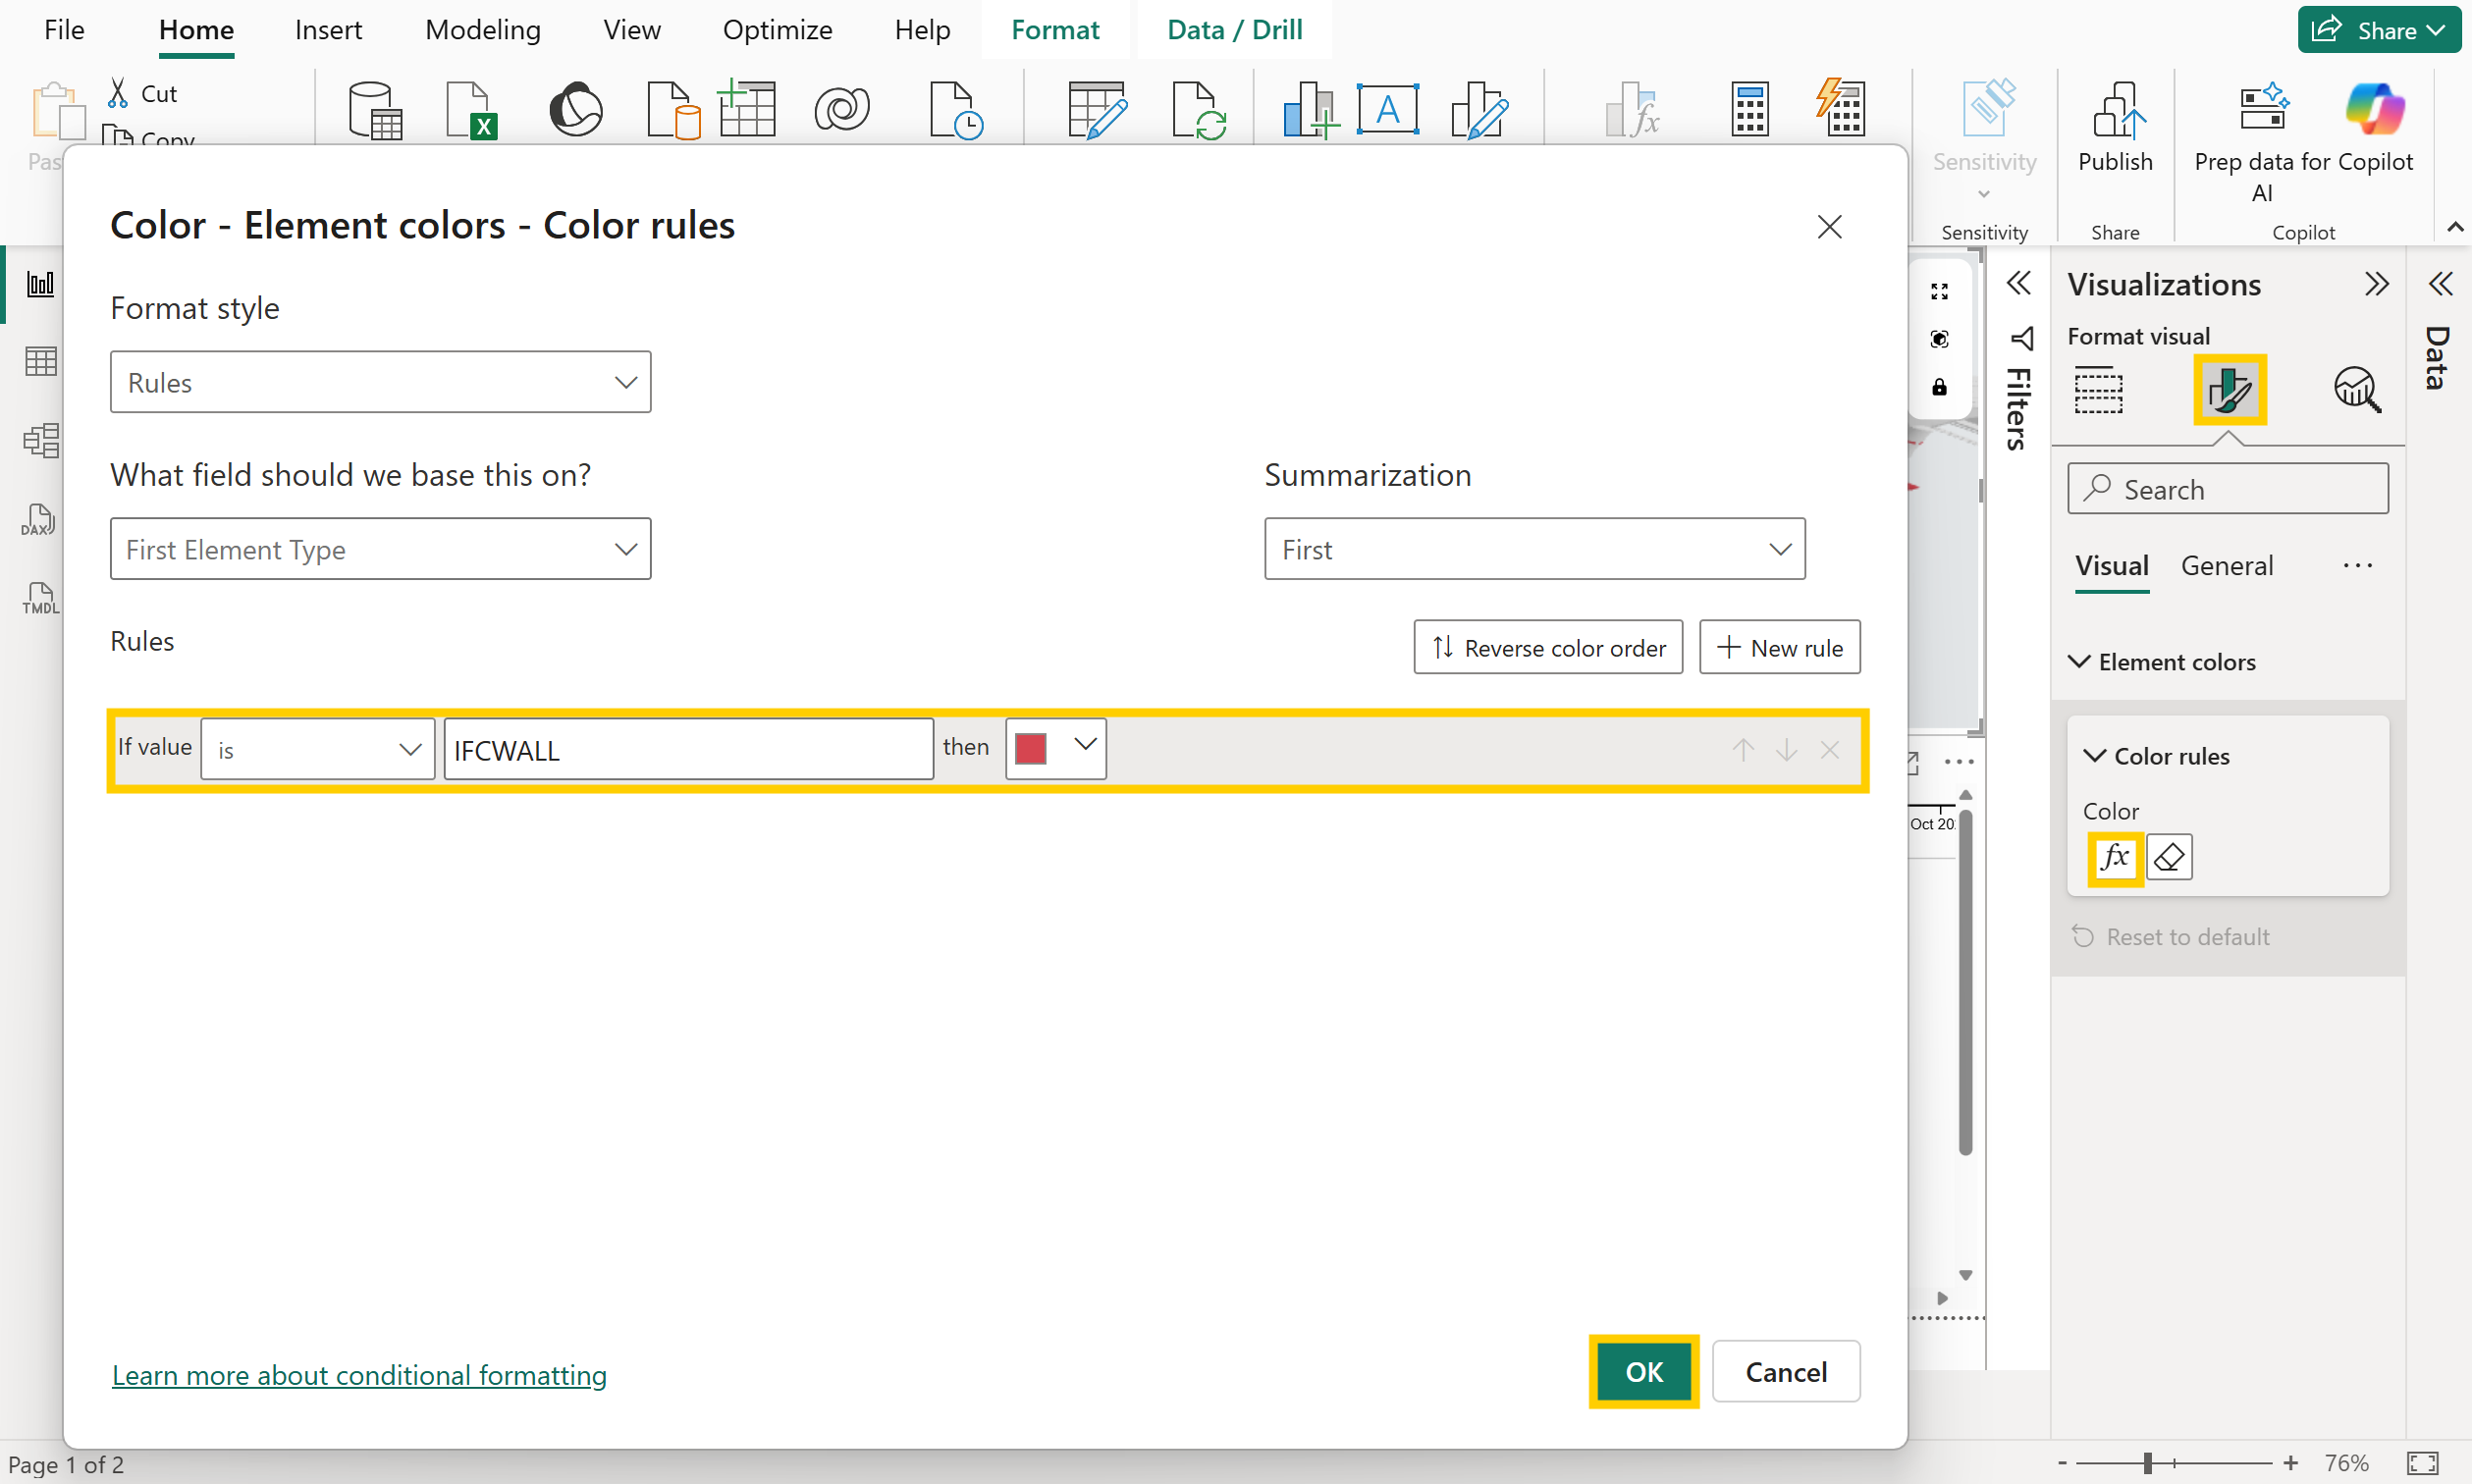
- Open the Format visual pane and expand Element colors.
- Under Color rules, set Format style to Rules.
- Choose the field that should define your segmentation under What field should we base this on?
- Example: Element Type for discipline-based coloring.
- Add rules for the values you want to highlight and assign the desired colors manually.
- Select OK to apply the formatting.
Option 2: Use colors from your data
When to use data-driven colors
Use this mode when the color should come from the dataset:
- You want a single, consistent palette controlled by your dataset.
- You have many categories or evolving rules that would be tedious to enter manually.
- Multiple visuals (including non‑3D charts) should share the same colors.
- You want to let authors update colors by editing data, not visual settings.
How to use data-driven colors
- Create a DAX column in the IFC table:
- In Power BI Desktop, go to Data view, select the IFC table, and click New column.
- Paste this formula and press Enter. Adapt the field checks and hex codes to your needs.
Colors =
SWITCH(
    TRUE(),
    'IFC'[Element Type] = "IFCWALL" , "#FF0000", -- red
    CONTAINSSTRING ( 'IFC'[Element Name], "door" ) , "#0000FF", -- blue
    "" -- default
)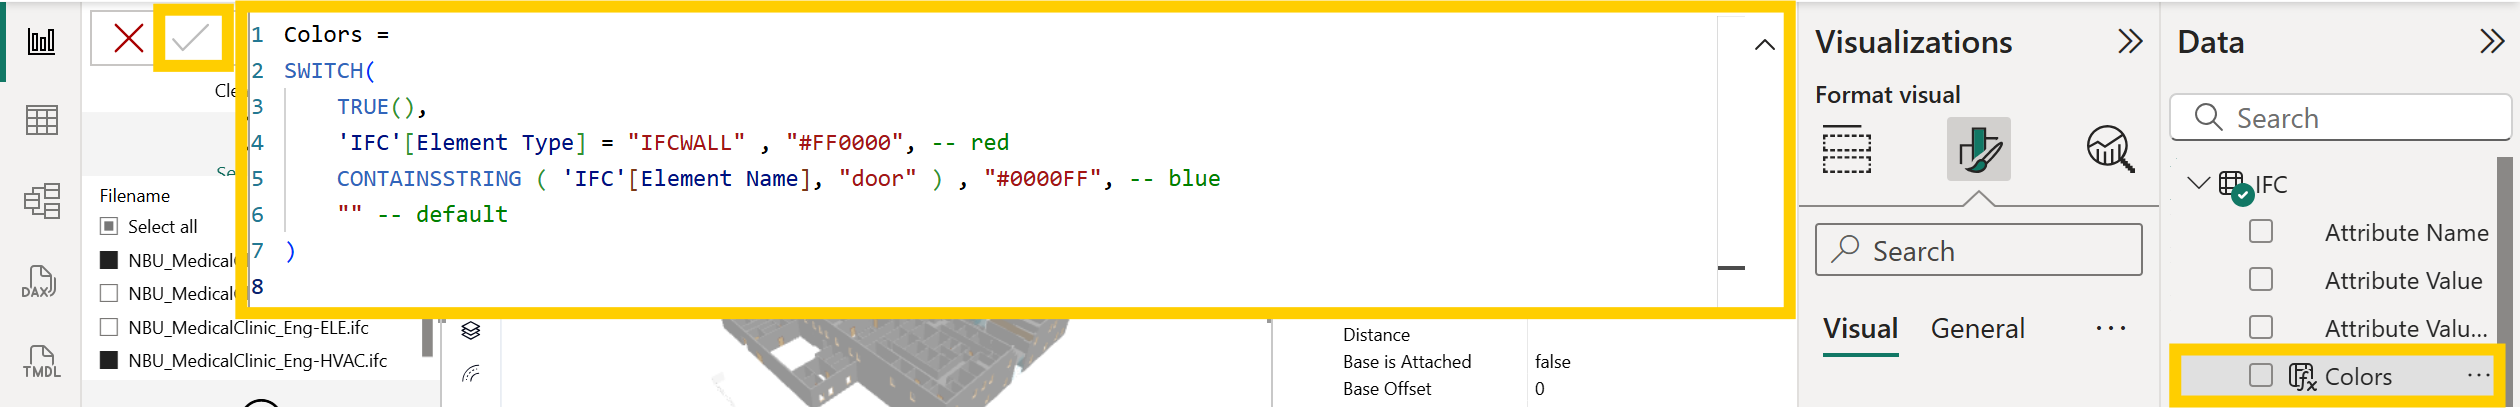
- This DAX formula allows complex element filtering - walls turn red and any element containing "door" in its name becomes blue. Elements not matching any condition keep their default appearance.
- Leverage any DAX logic including CONTAINS, CONTAINSSTRING, comparison operators (<, >, =), AND/OR conditions, or numerical checks. Examples:
-- Multiple string checks
CONTAINSSTRING('IFC'[Name], "fire") && CONTAINSSTRING('IFC'[Type], "door")

-- Numerical comparisons
'IFC'[Height] > 2.4

-- Complex conditions
OR(
    AND('IFC'[Level] = "L1", 'IFC'[Category] = "Walls"),
    'IFC'[FireRating] = "EI60"
)
- Select the IFC Viewer visual on your report canvas.
- Open Format visual > Element colors > Color rules and set Format style to Field value.
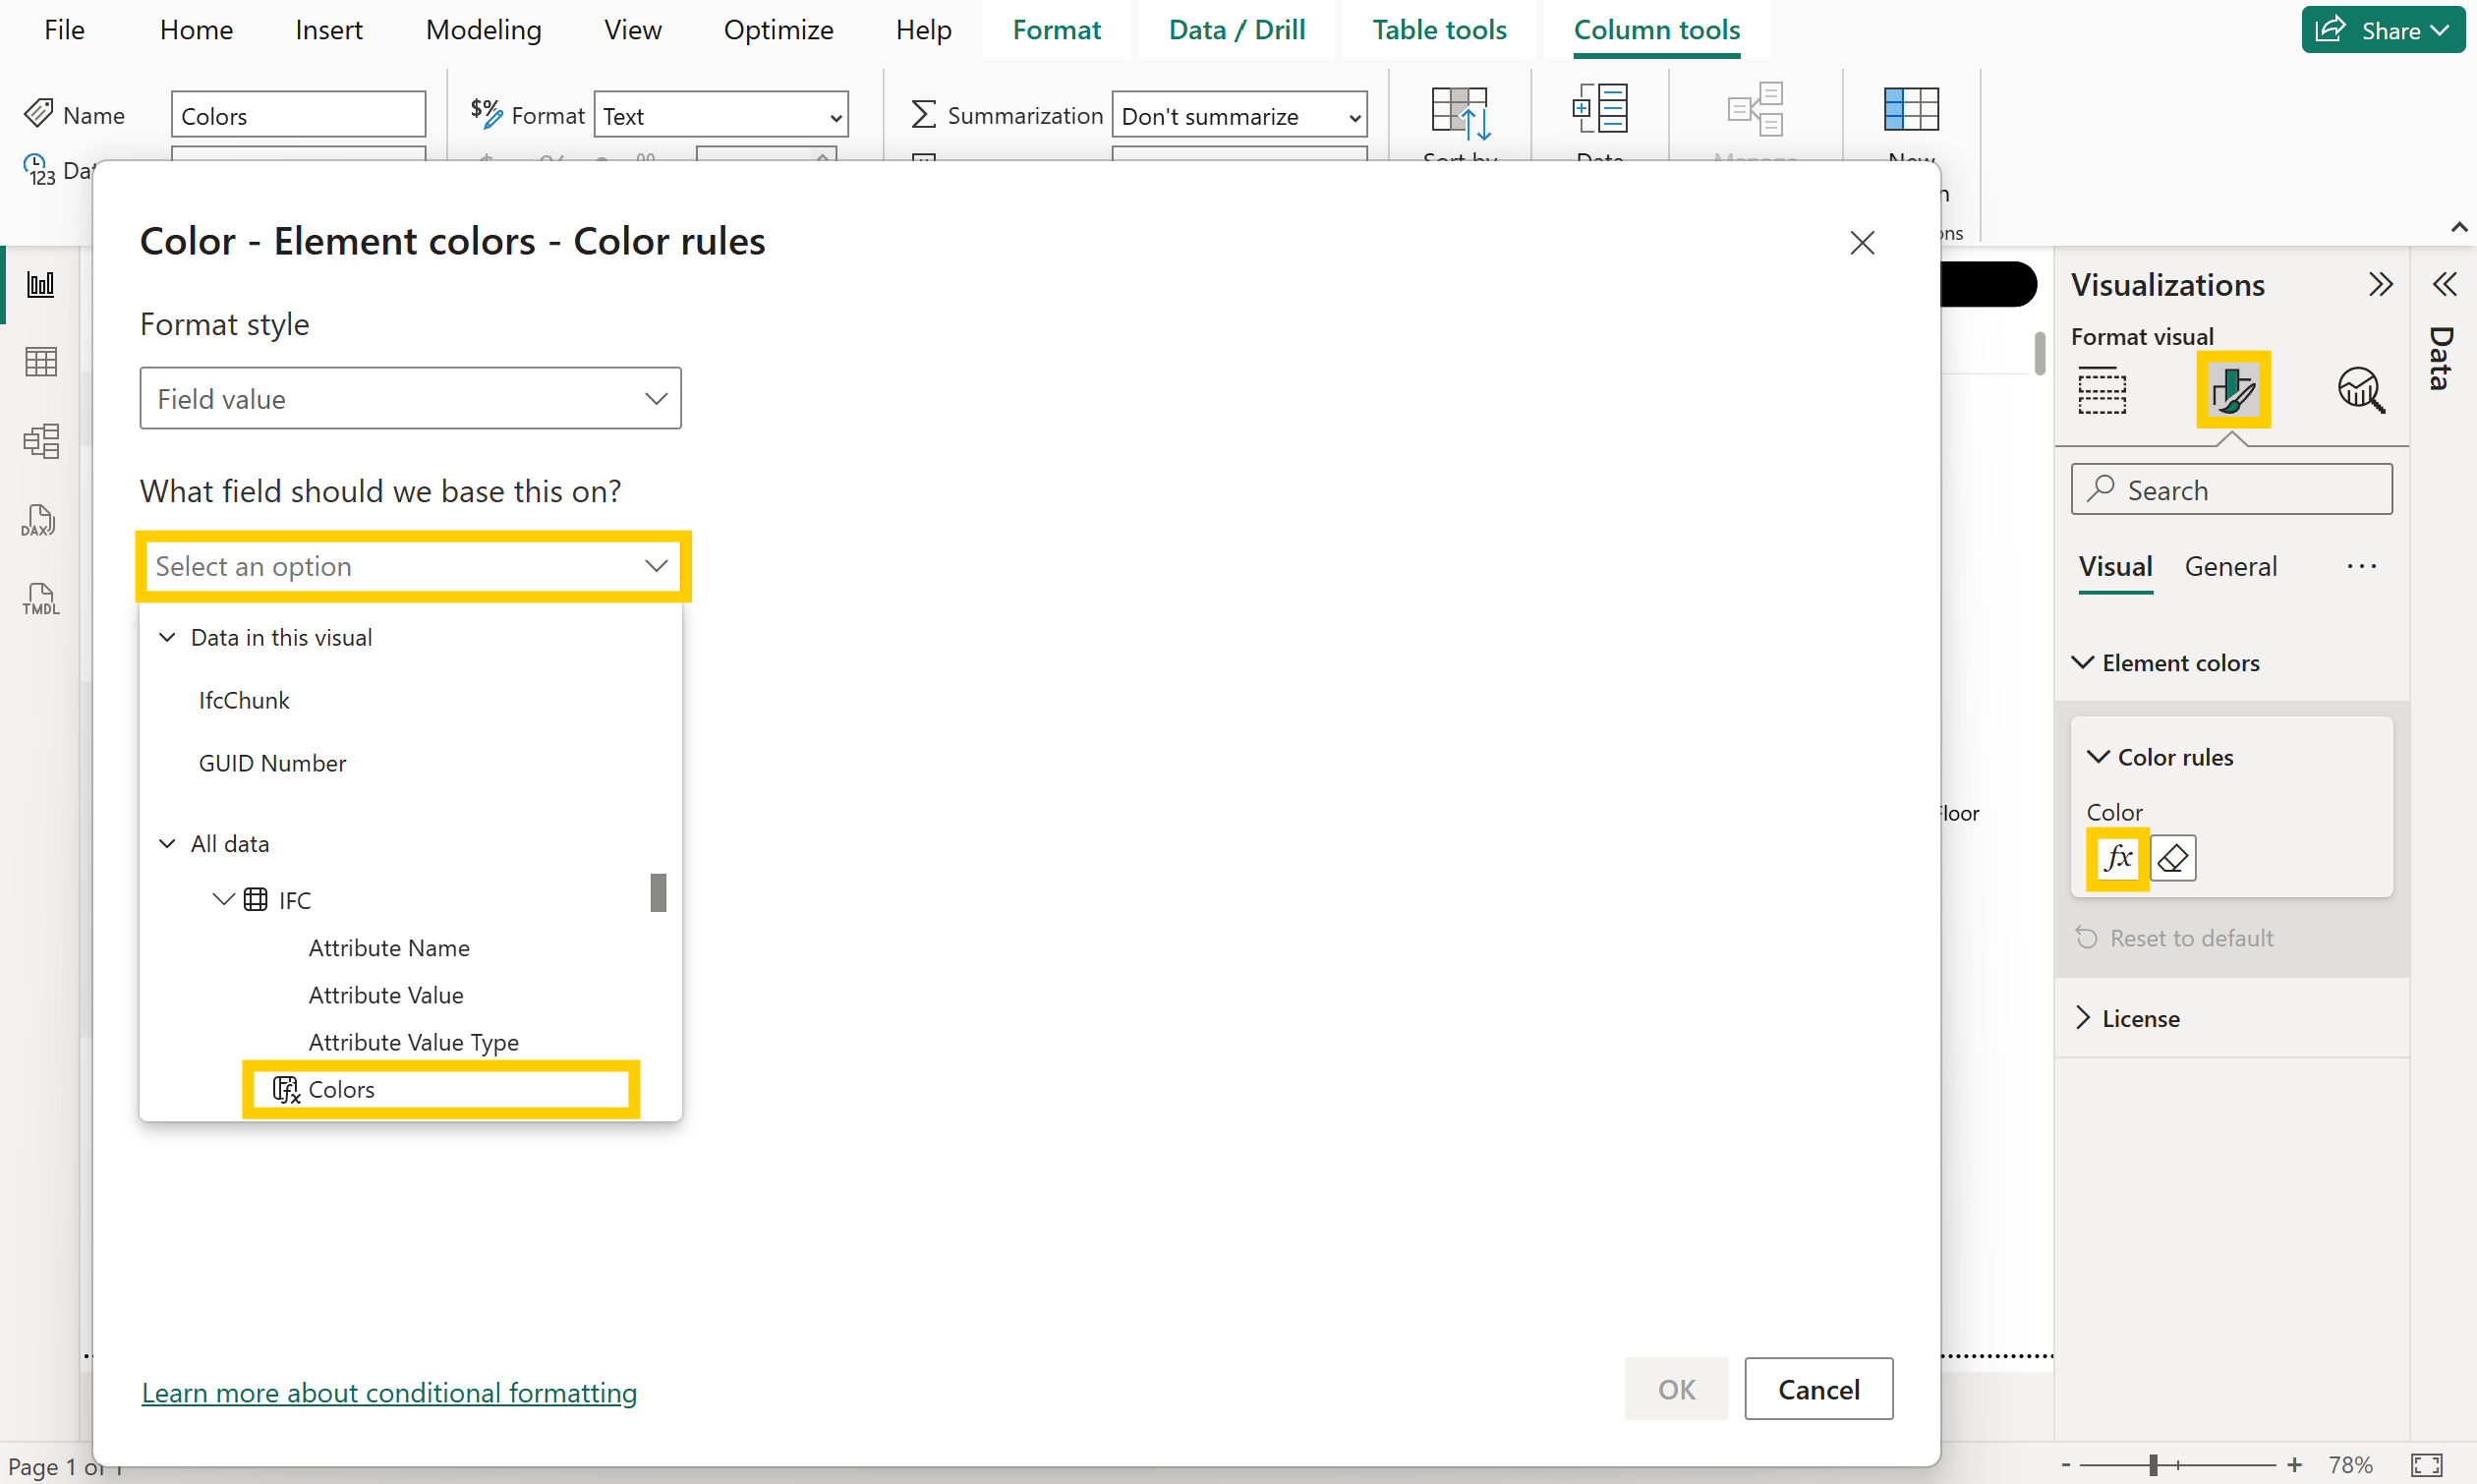
- Pick the column that holds the color code under What field should we base this on? (for example, IFC[Colors] or Colors[Color]).
- Confirm with OK. The visual now reads the hex or color name from your dataset and applies it directly to each element.
Tip
Field‑value formatting keeps palettes consistent across visuals. Reuse the same color table for other charts and slicers so that statuses or disciplines always appear with the same color.