Use the 3D IFC Viewer with Power BI
You can use the 3D IFC Viewer in Power BI either by quickly starting with the ready-made sample report from AppSource, or by manually integrating the visual and required functions into your own existing or blank report for greater flexibility.
Option 1: Quick start with the sample report
1. Download sample report and edit parameters in Power BI Desktop
Download the sample Power BI report from AppSource. Open it in your Power BI Desktop application and navigate to Edit Parameters under the Home tab.
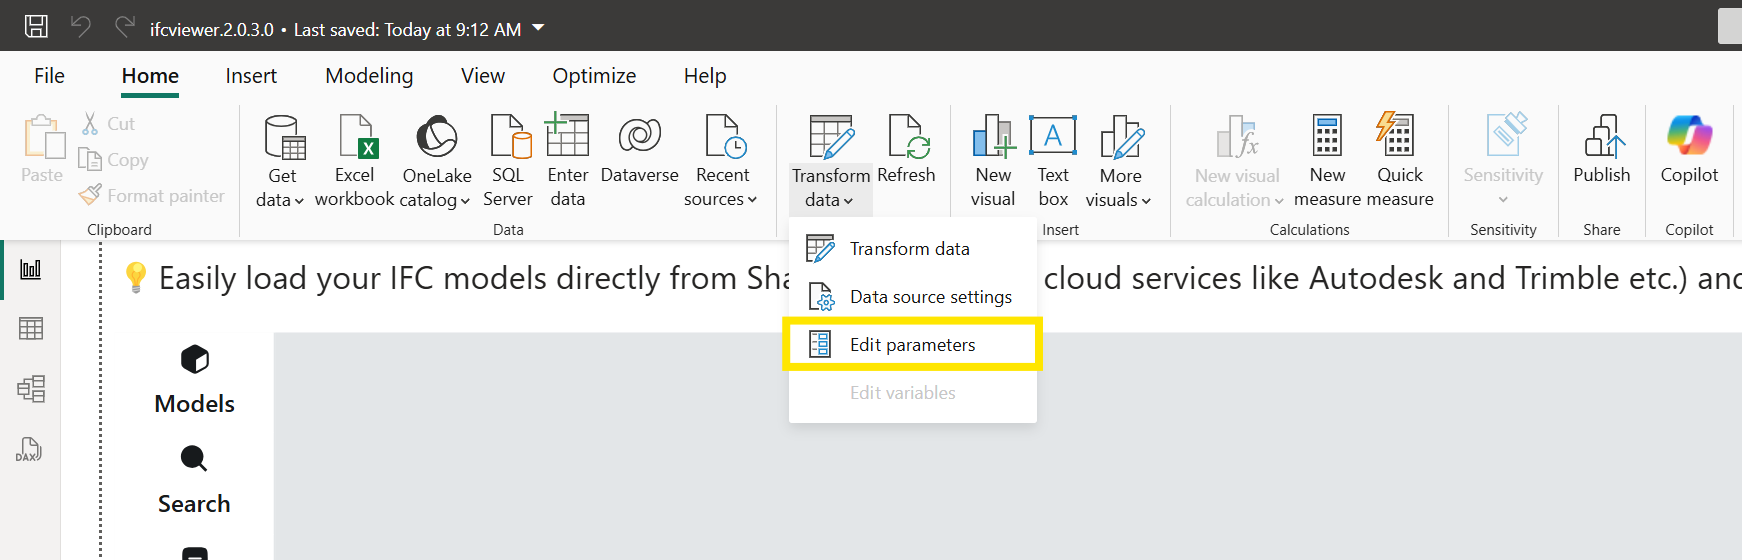
Note
The Edit Parameters option is only enabled if the IFC loading query is included in your report; If Edit Parameters it is greyed out, copy the IFC loading query from the sample report.
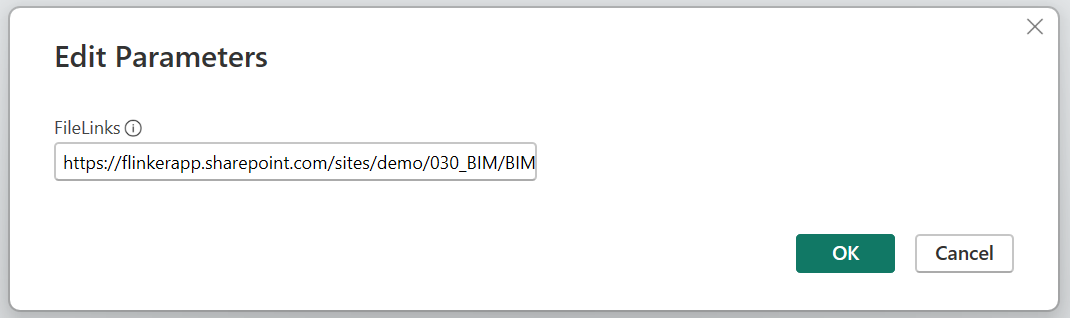
2. Paste the IFC file path into parameters
Paste the copied IFC file path into the respective parameter field in Power BI. Confirm your changes by clicking OK.
The following file paths are supported:
Local file path: To use a local IFC file, first copy its file path. In Windows, open File Explorer and navigate to your IFC file. Right-click the file, and select Copy as path. This copies the full file path (e.g.,
C:\Users\YourName\Documents\example.ifc) to your clipboard.Note
Make sure there are no quotation marks (
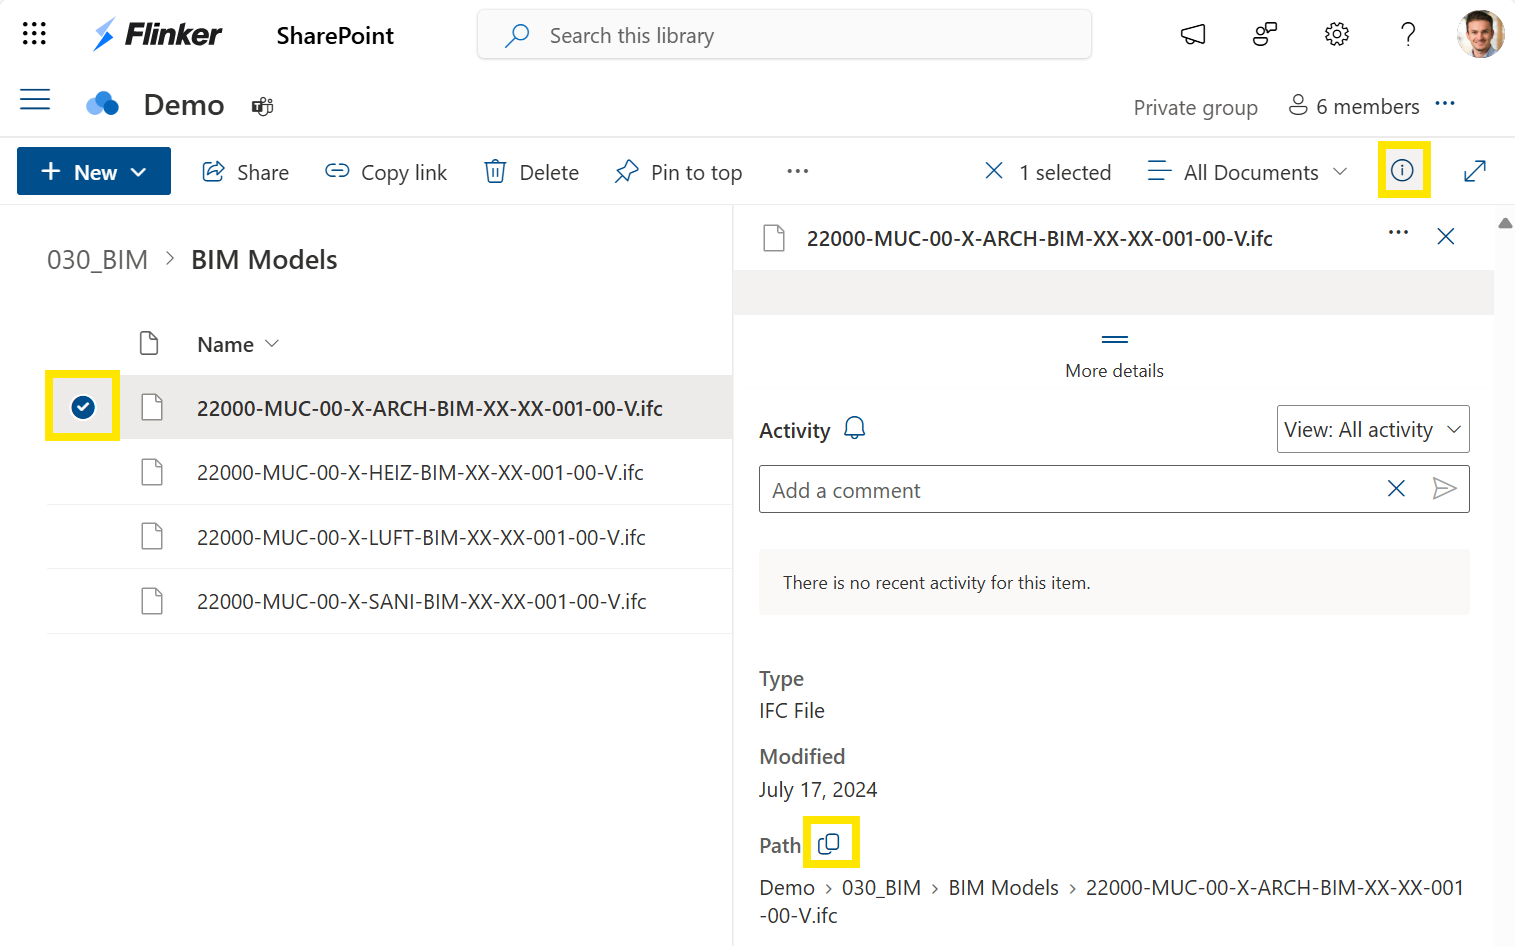
") at the start or end of the file path you paste. If you see any, delete them before proceeding.SharePoint file path: You can use a direct SharePoint IFC file link by authenticating with your Microsoft organization account. To use a SharePoint file, locate your IFC file in SharePoint, click on the file, and select Details from the menu. Under the Details pane, find the Path section and copy the plain file path (not the sharing link). This direct path is required for the IFC Viewer to access the file correctly.
Note
Be sure to use the correct SharePoint file path. Shared links will not work.
Public cloud file link: Alternatively, anonymous or public file links from sources such as GitHub, Autodesk, Trimble, or Google Drive are also supported.
Folder loading
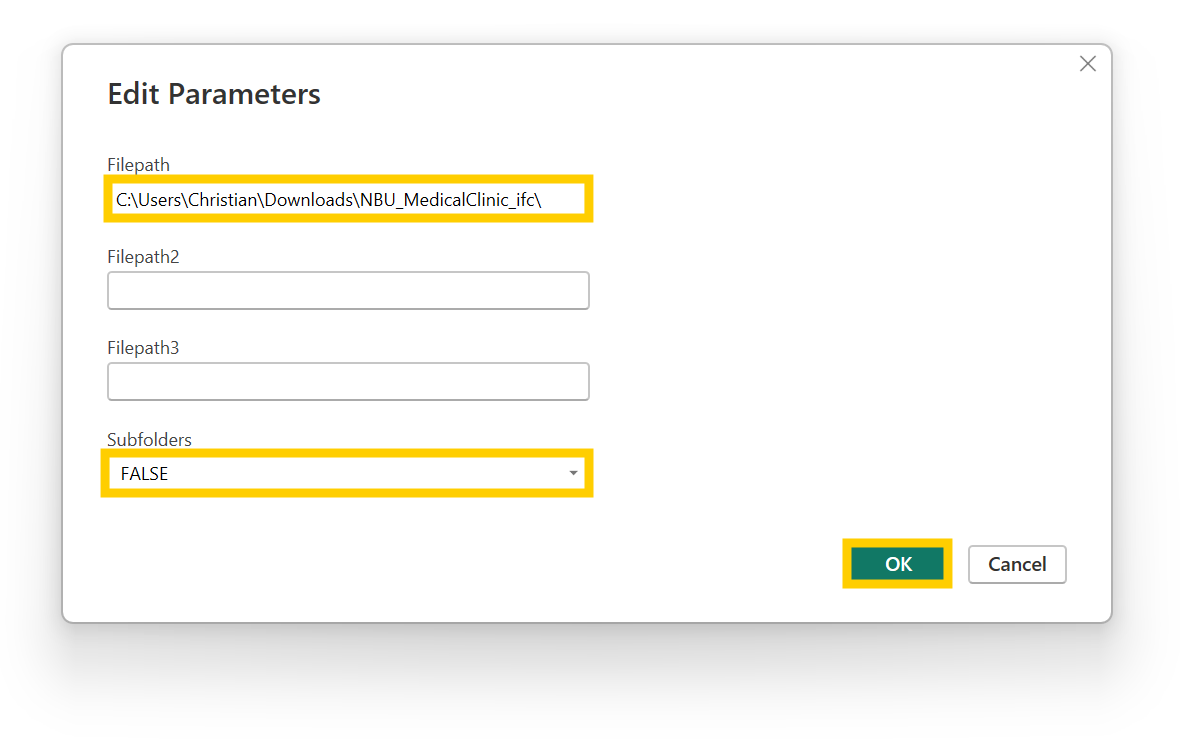
To load multiple IFC files without the IFC connector (.mez), use direct IFC file paths in Filepath, Filepath2, and Filepath3.
Folder loading requires the IFC connector (.mez) and Pro features. After the connector is installed, paste a folder path into Filepath instead of a single .ifc file. Set Subfolders to TRUE if you want to include IFC files from nested folders, then select OK.
For more information about the connector, see Load complete IFC data with the Power BI data extension.
If your report opens with an active filter, connect that filter to the IFC files by Filepath or Filename. For details, see Load and filter multiple IFC files in Power BI.
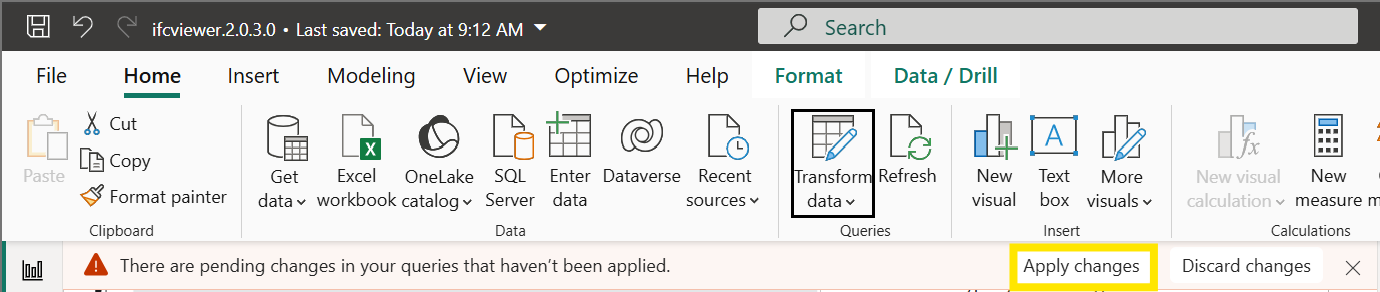
3. Apply changes
After editing the parameters, apply the changes in Power BI by selecting Apply Changes from the prompt or toolbar.
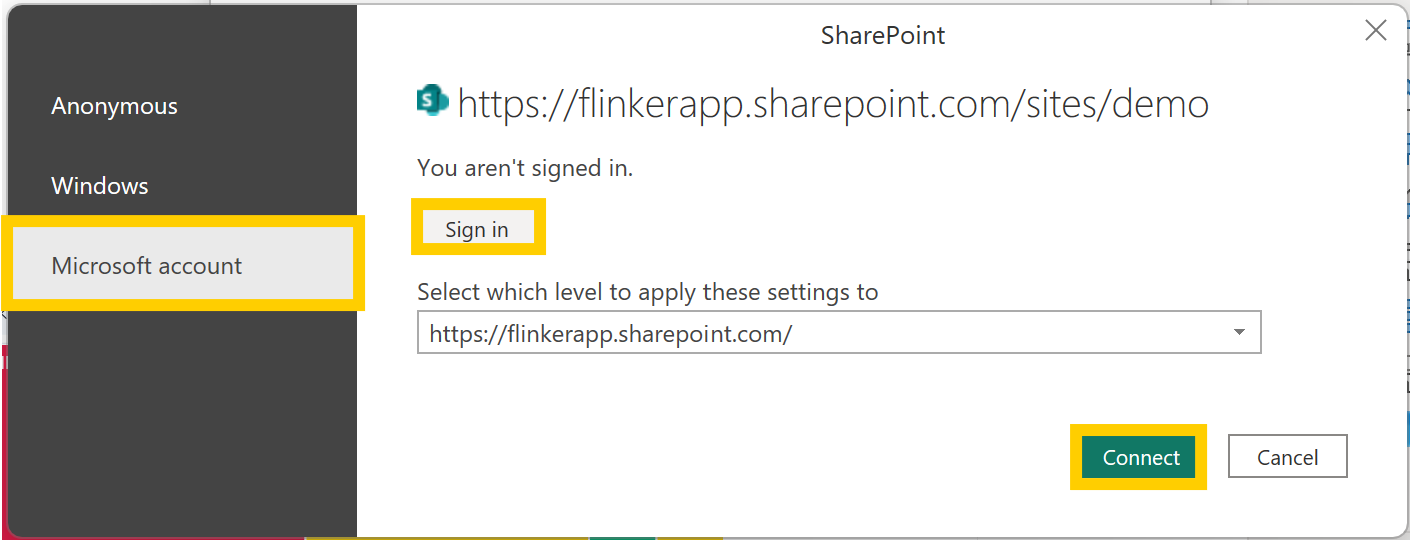
Sign in with your organization account (only for SharePoint file links)
If you are using a SharePoint file, Power BI may prompt you to sign in with your Microsoft organization account to access the file. Sign in to your Microsoft organization account to securely access SharePoint files. Follow the on-screen prompts to provide your corporate credentials.
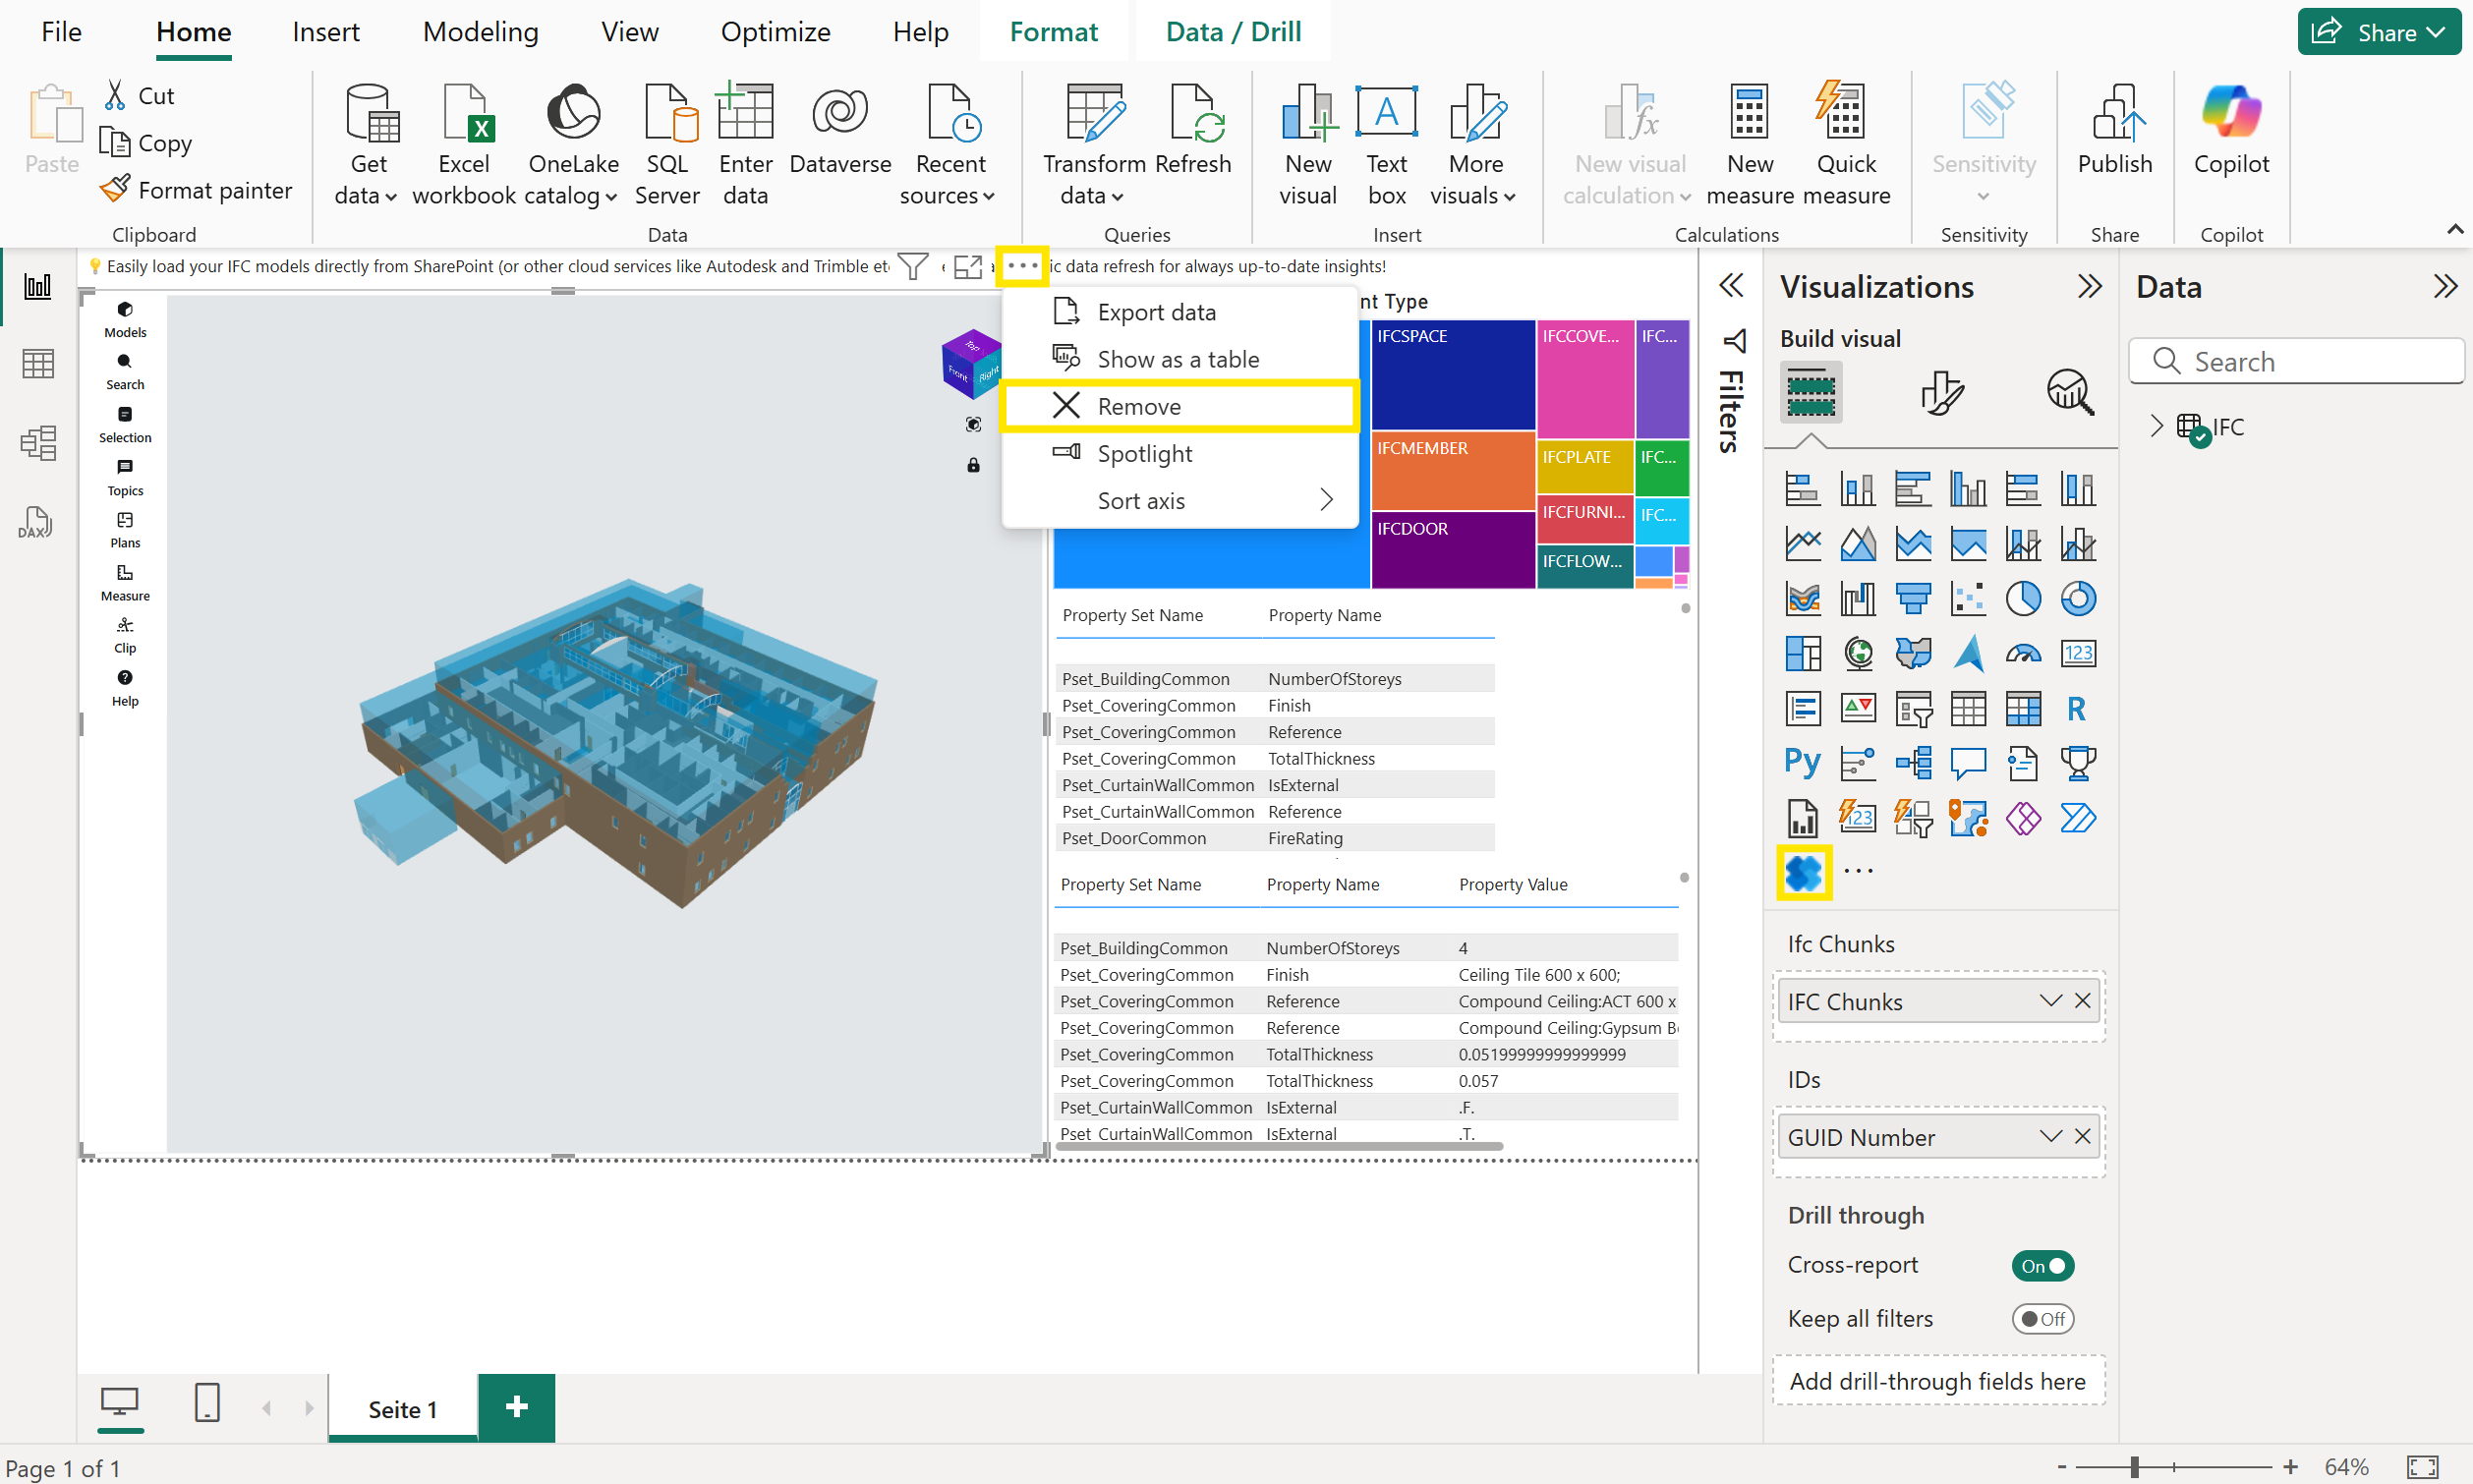
4. Confirm loaded properties and model
Sometimes, you may need to refresh the visual by removing and adding it again. To do this, right-click on the visual and select Remove. Then, add the visual back to your report.
Once applied, ensure that the properties and IFC model are loaded correctly within your Power BI project.
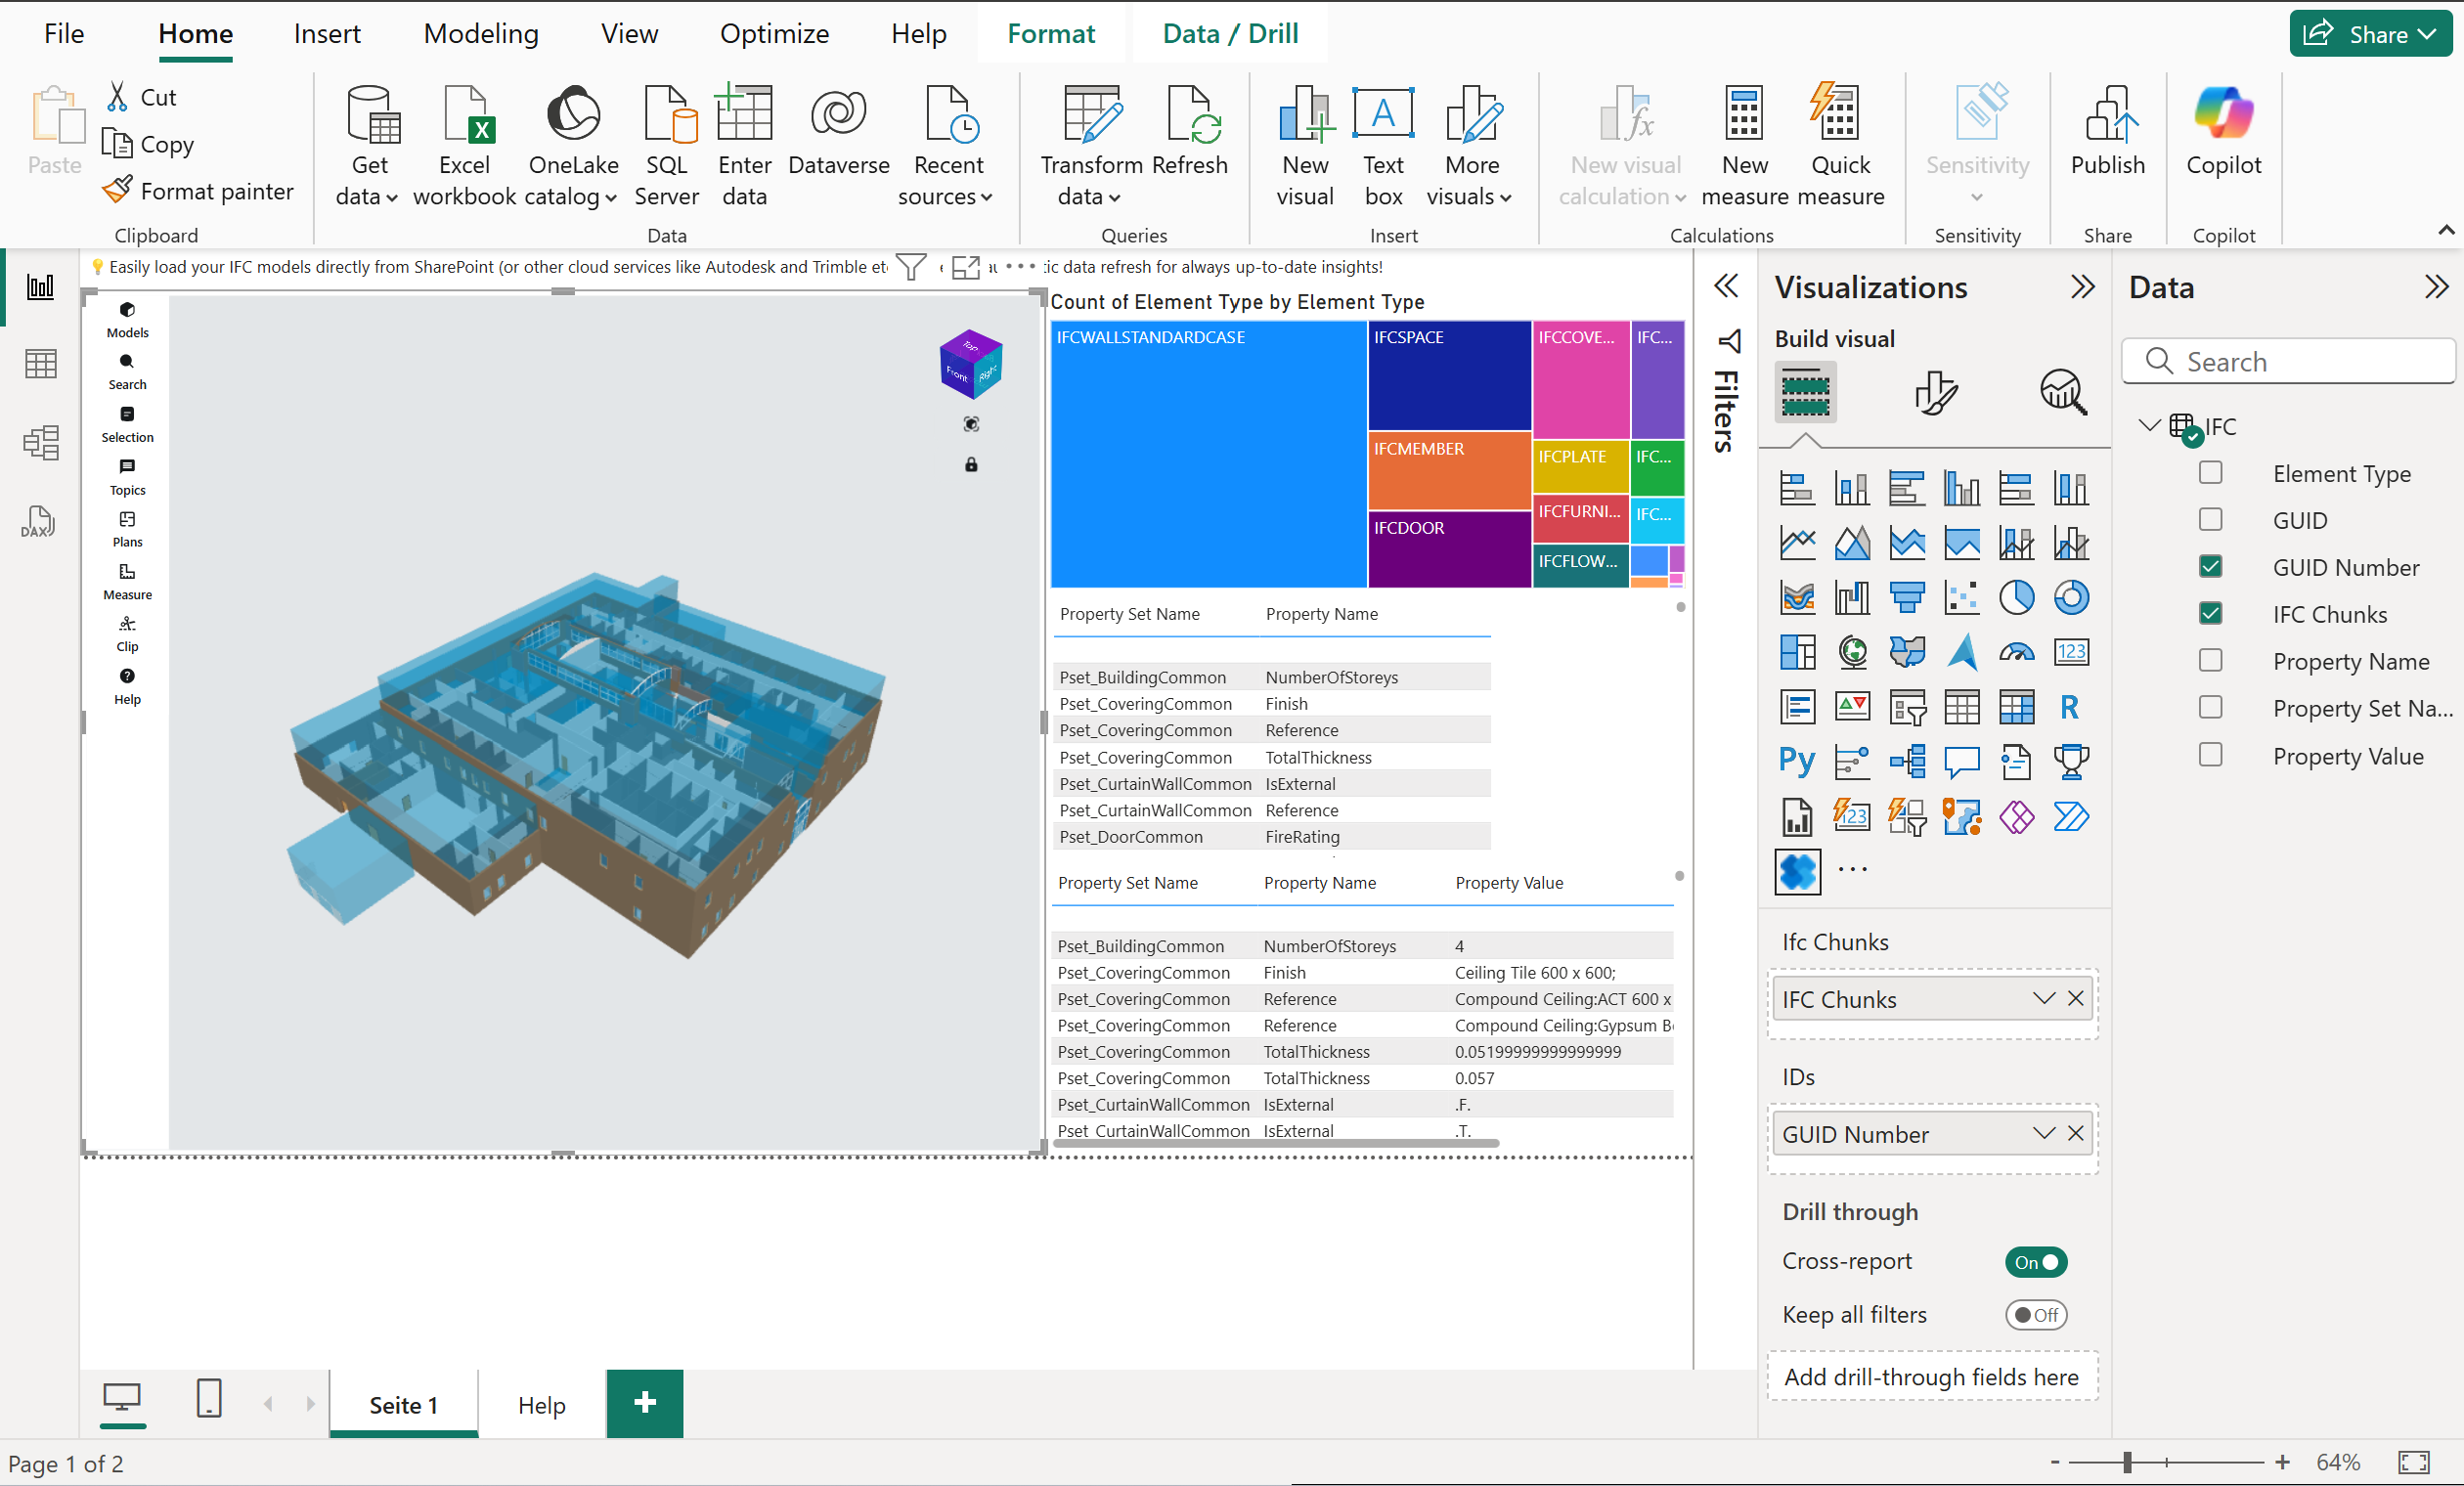
You are now ready to visualize your IFC model directly in Power BI using the IFC Viewer.
Option 2: Integrate into an existing or blank Power BI report
If you already have an empty Power BI report or an existing report and want to integrate our IFC Viewer visual, watch the video and follow the below steps:
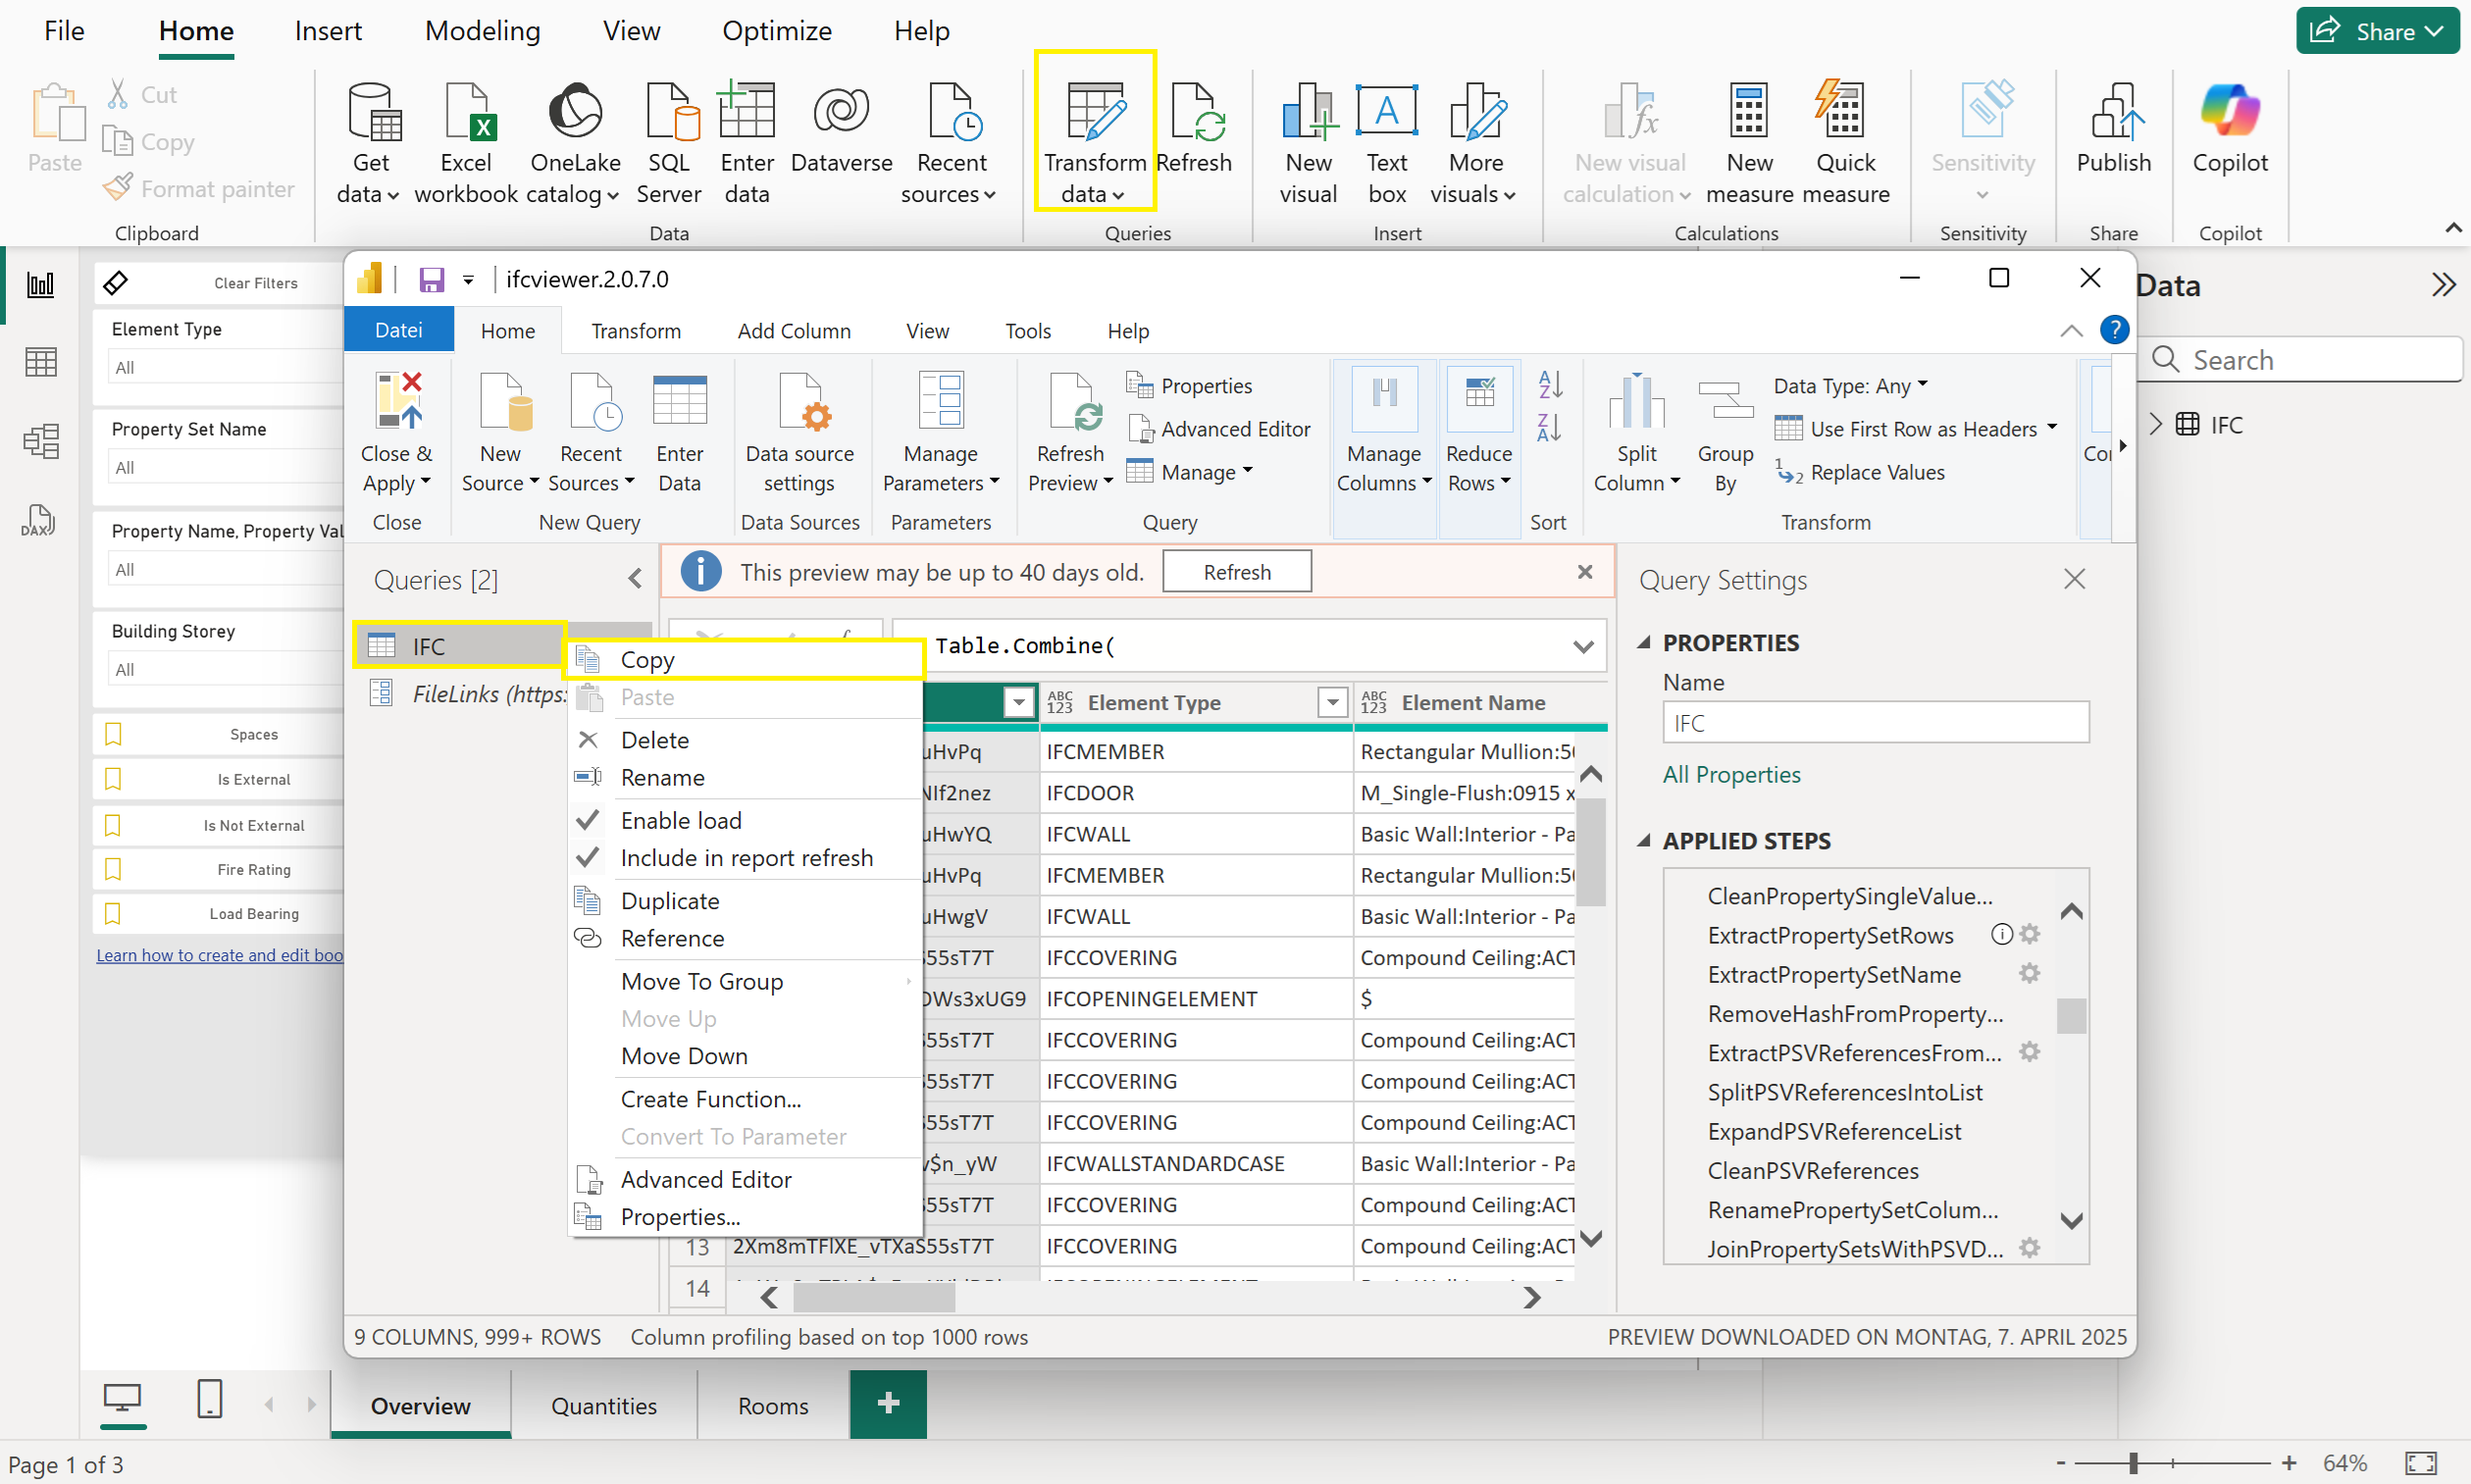
1. Copy the IFC loading query from the sample report
- Open the sample report .pbix (download from AppSource) in Power BI Desktop.
- Go to Transform Data.
- Locate the query used to load IFC files (usually named
IFCor similar). - Right-click the query and select Copy.
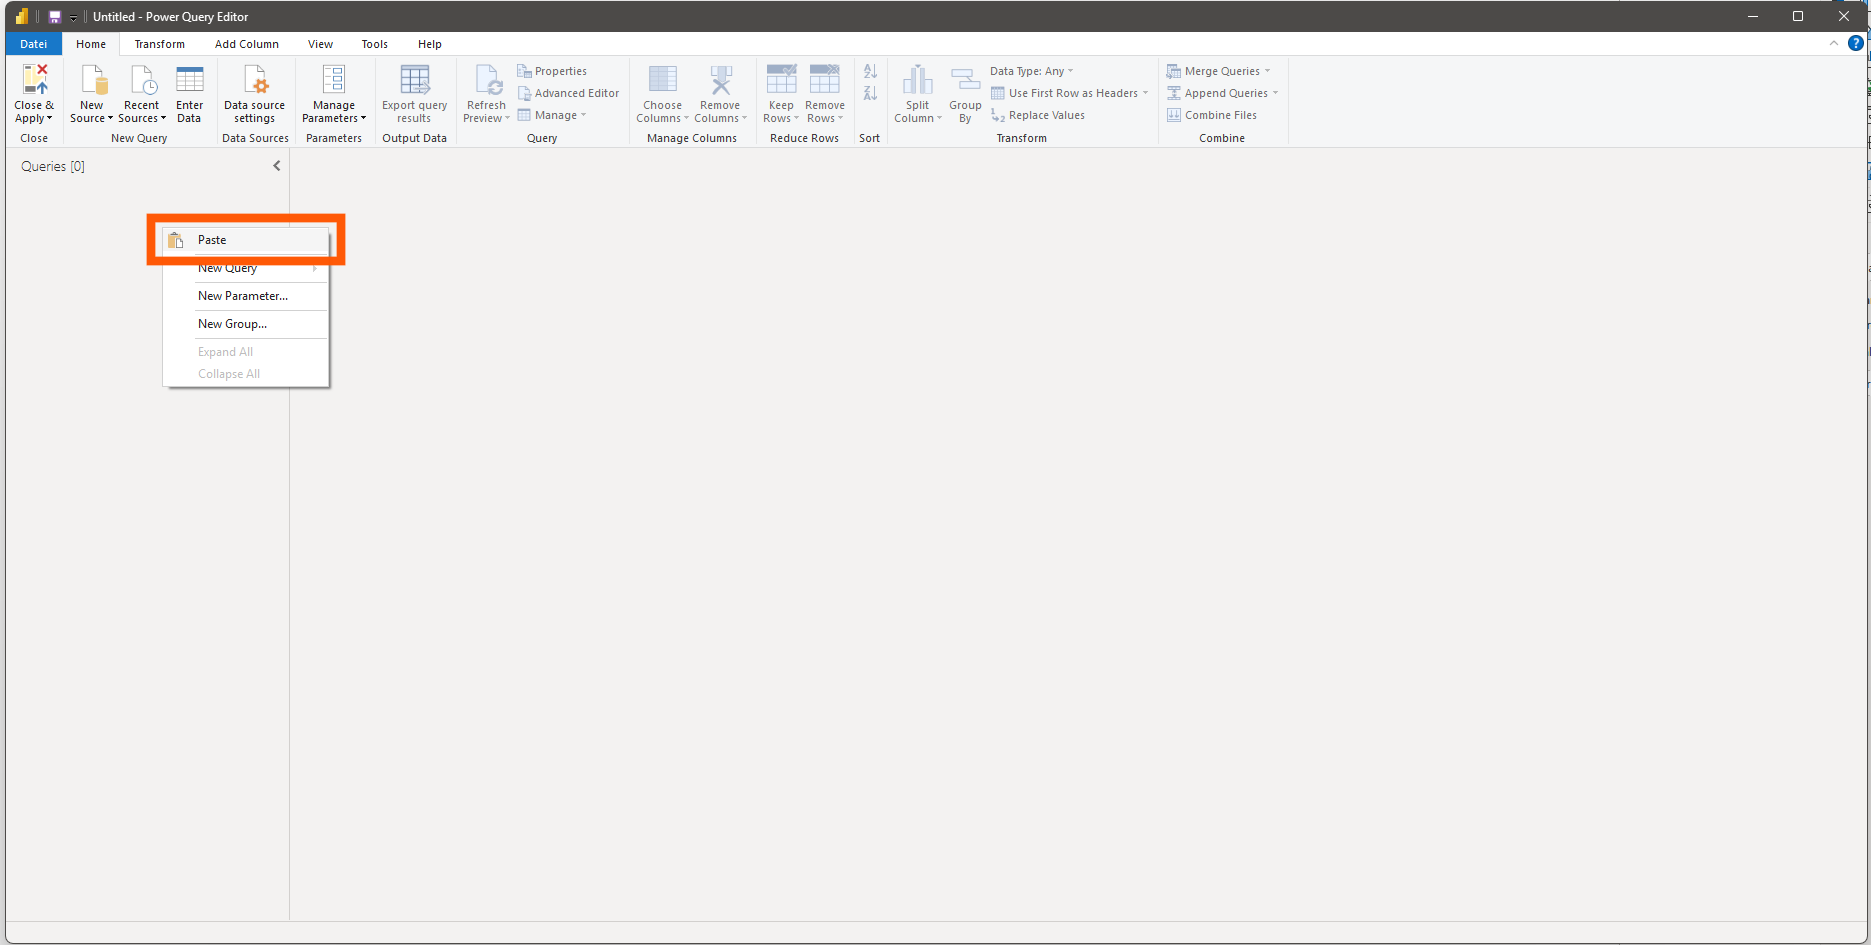
2. Paste the query into your own report
Open your own report, go to Transform Data, right-click in the Queries pane, and select Paste.
Adjust the file location parameter to connect your model. Click here to learn how to point and load multiple IFC files from a folder.
Click Close & Apply to save the changes and load the data into your report.
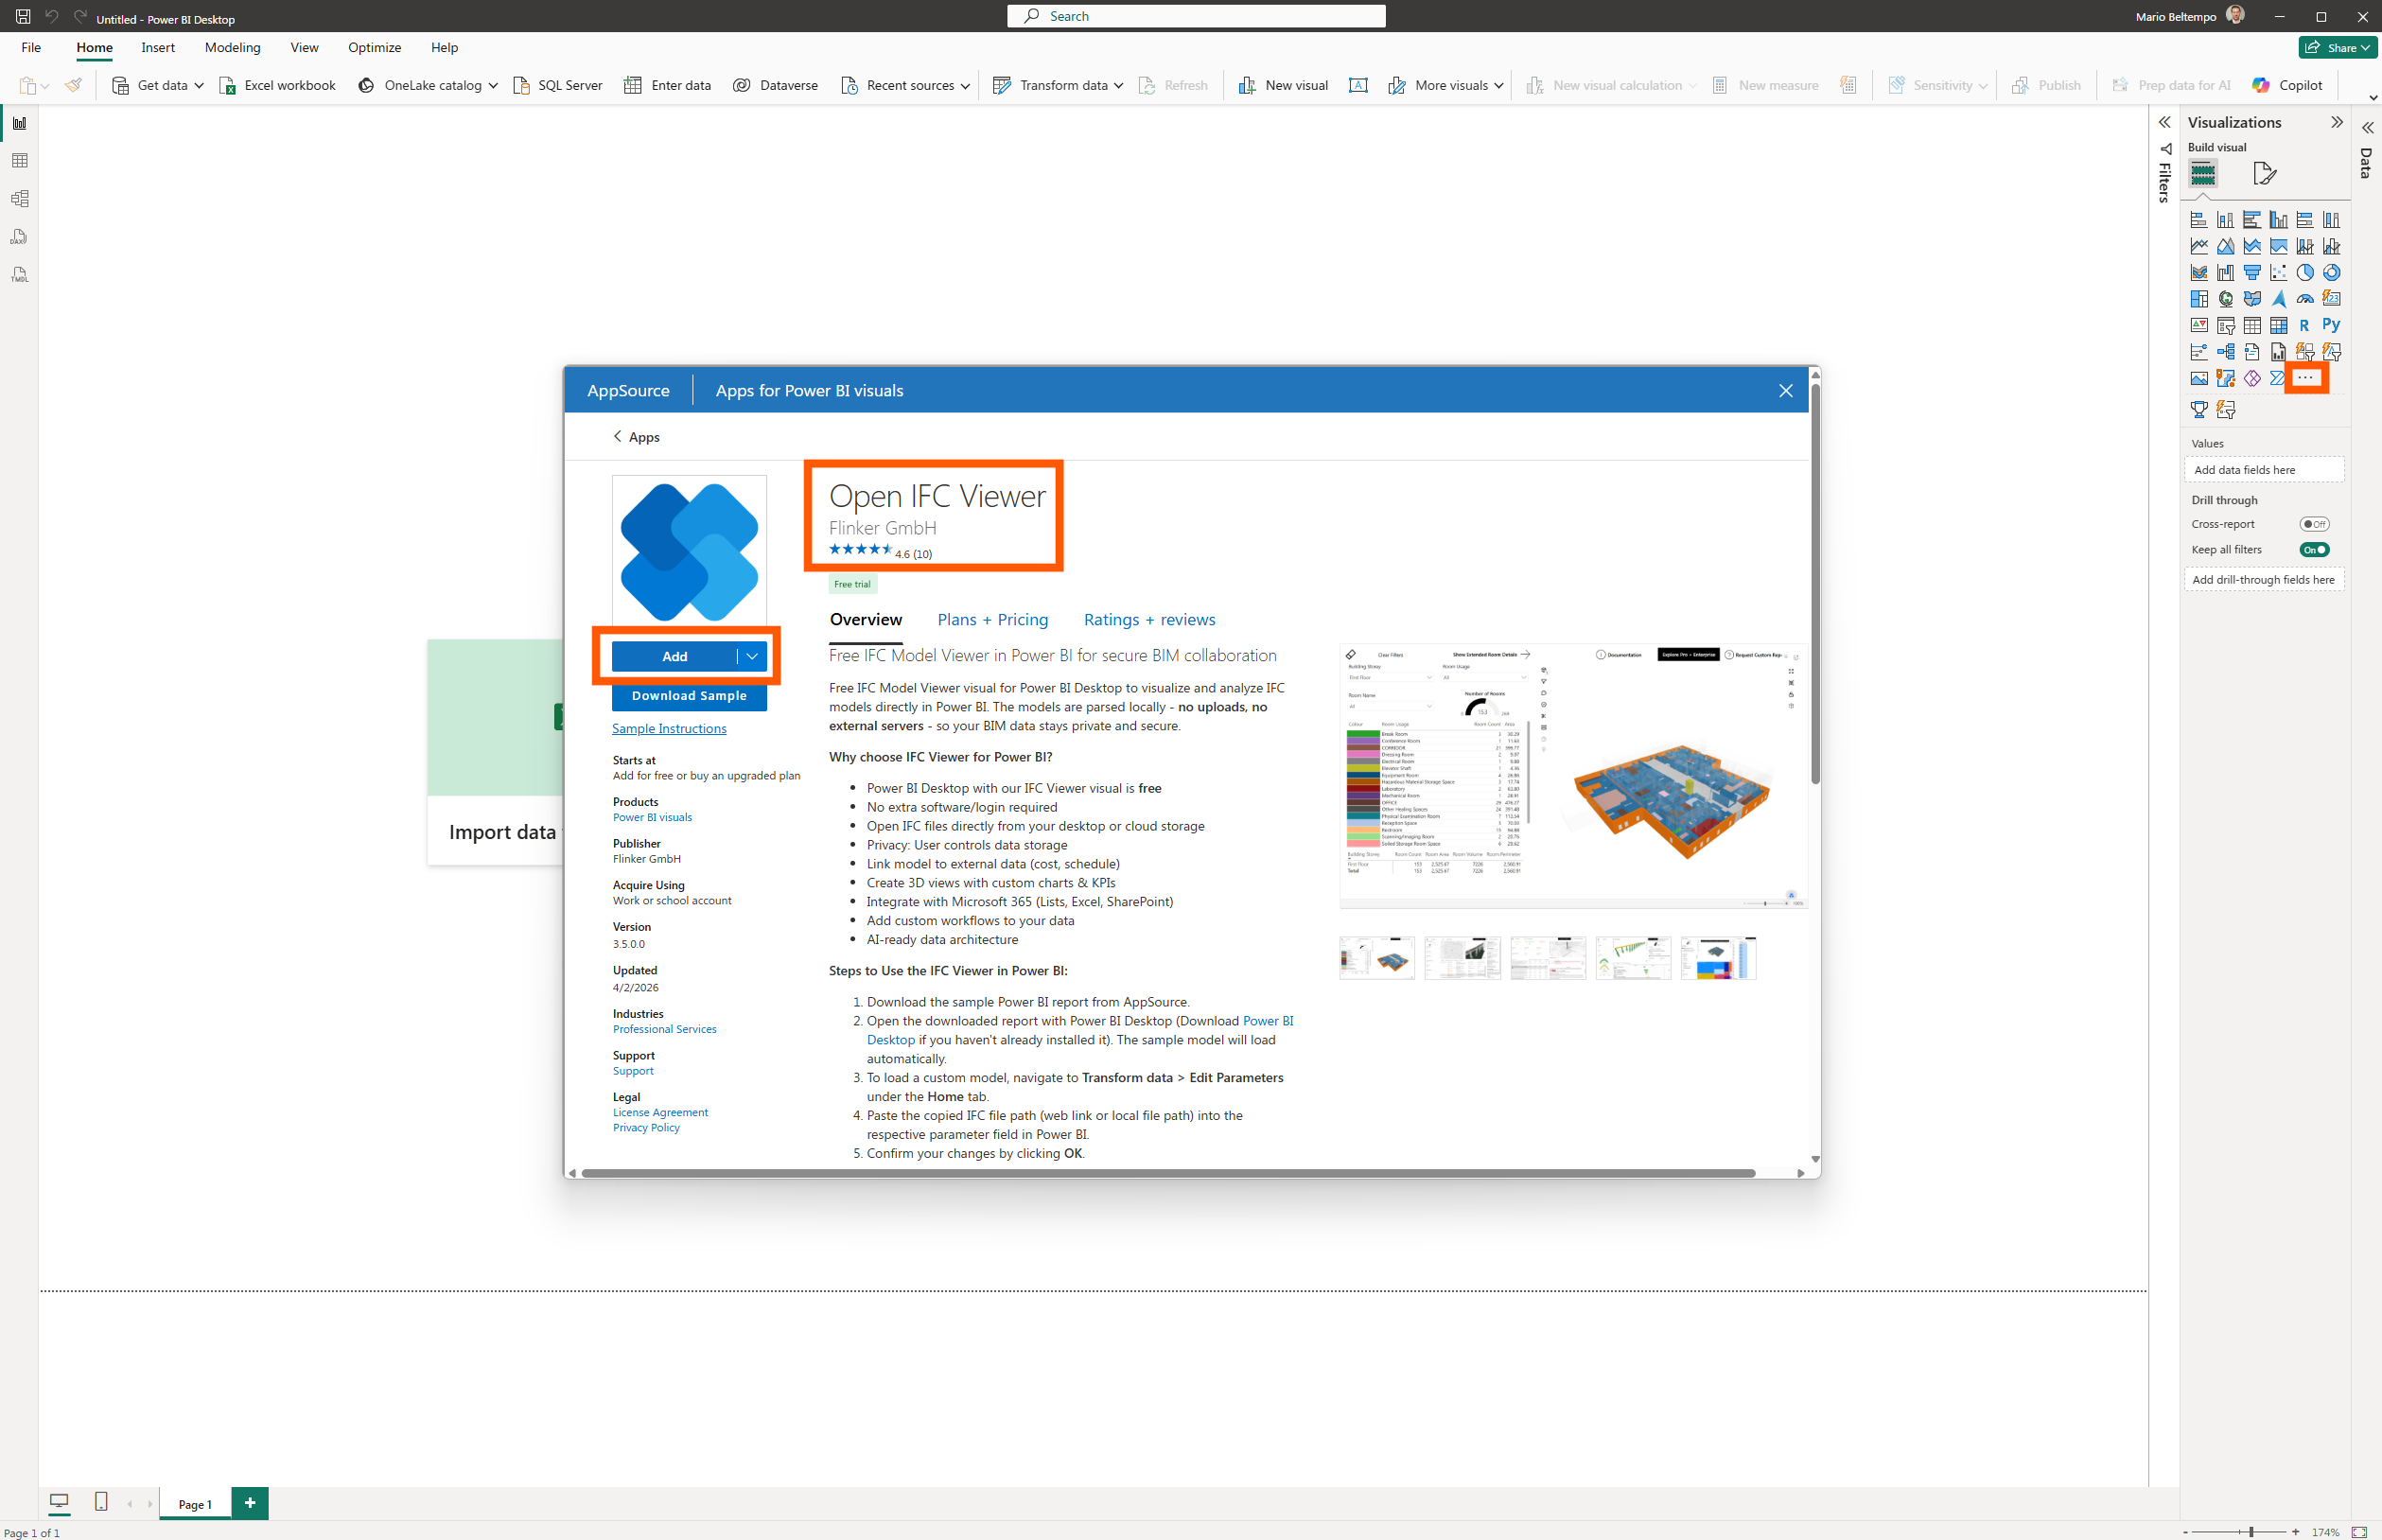
3. Add the IFC Viewer Visual from AppSource
- In Power BI Desktop, go to the Visualizations pane and click on Get more visuals (… ) to search the IFC Viewer visual in the AppSource and add the IFC Viewer visual to your report.
 2. Once added, find the IFC Viewer icon in the Visualizations pane and click it to add the visual to your report canvas.
3. Bind the required fields to the IFC Viewer visual
Drag and drop the
IFC Chunksfield from yourIFCquery table to the IFC Chunks data field of the IFC Viewer visual. This field contains the binary or text data representing the IFC model and is essential for rendering the 3D model in the viewer.Drag and drop the
GUIDsfield from yourIFCquery table to the IDs data field of the IFC Viewer visual. This field contains the unique identifiers for each element in the IFC model and is used to link the IFC data to other tables or visuals in your report.
Note
In the IFC Viewer Visual you can show or hide individual building elements (such as walls, floors, doors, windows, columns, beams, stairs etc.) by their unique GlobalId (GUID) e.g. 3zE3wwXjt4f9f19eugD1Q0. Other IFC objects (property sets, materials, etc.) may also have GUIDs, but they don’t map one-to-one to a visible element in your scene.

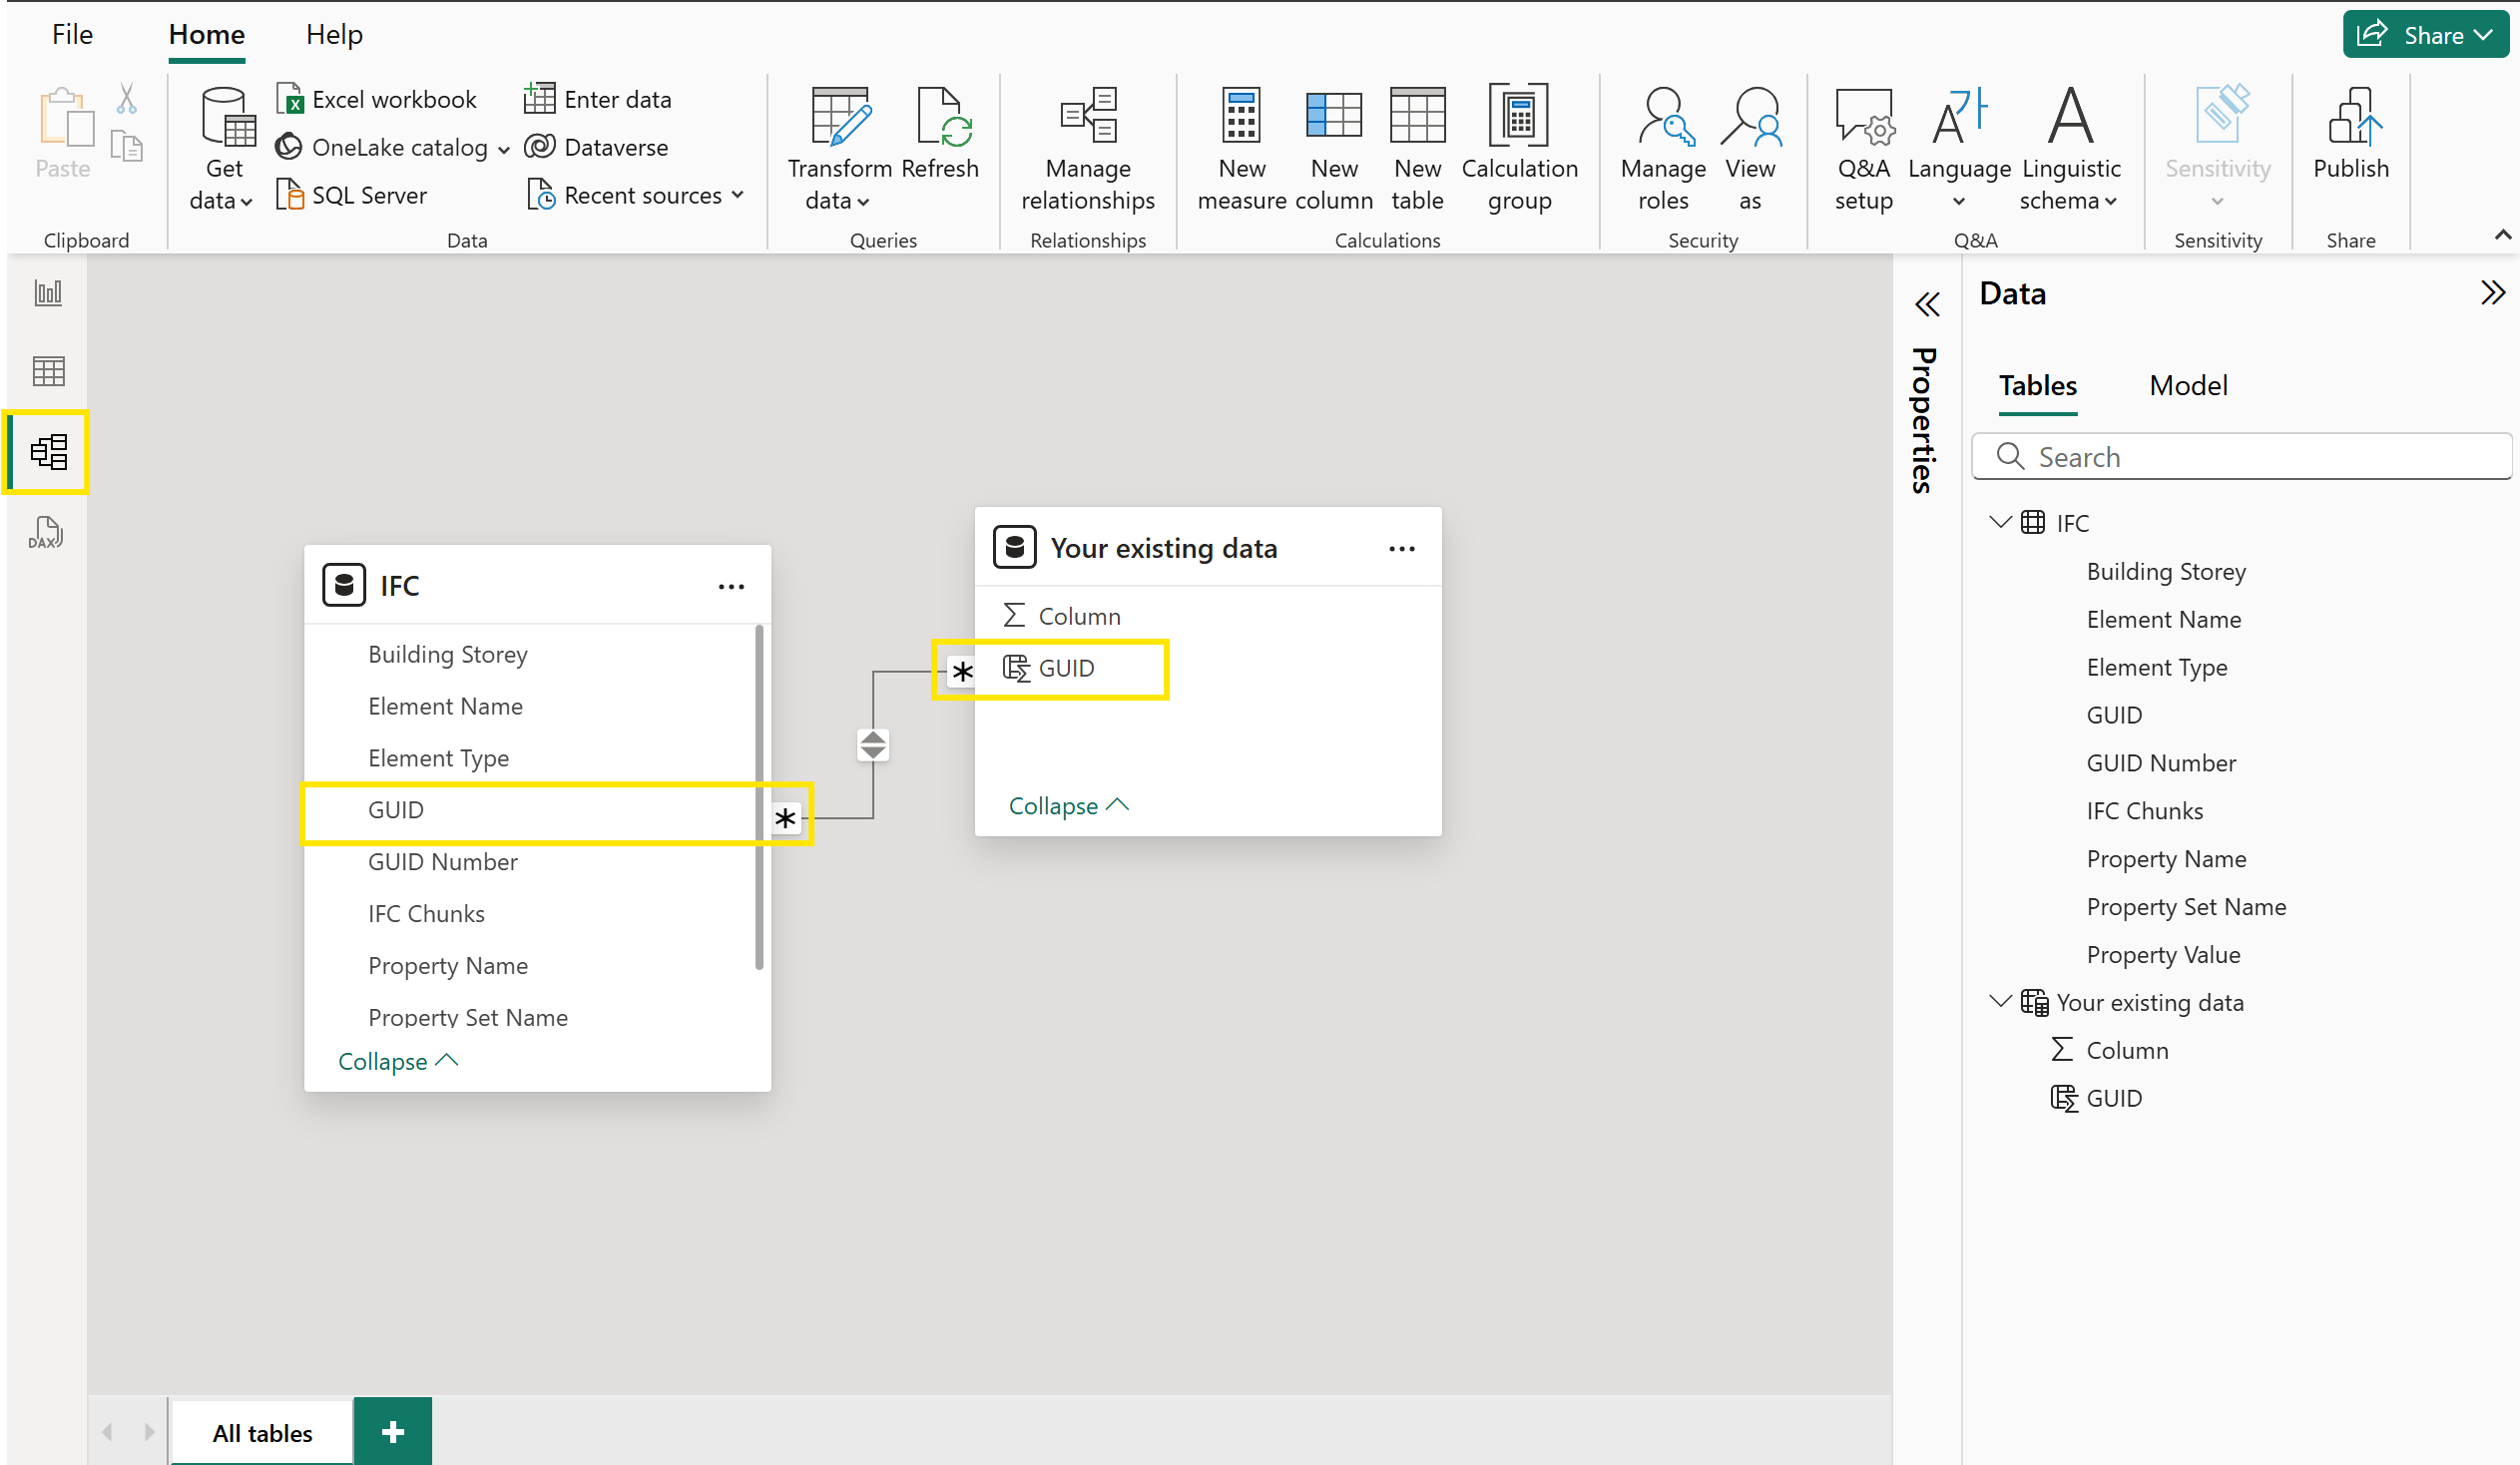
4. Optional: Link IFC Data to your existing data
- In the Model view, select your existing data table.
- Click Manage Relationships > New.
- Configure a relationship between your table’s GUID column and the
IFCquery’s GUID field. - Click OK and ensure the relationship is active.
You have now successfully integrated the 3D IFC Viewer into an existing or blank Power BI report. The IFC files will be loaded via the M functions and linked to your dataset by GUID, enabling seamless 3D visualization.